Hess 2008 Annual Report Download - page 3
Download and view the complete annual report
Please find page 3 of the 2008 Hess annual report below. You can navigate through the pages in the report by either clicking on the pages listed below, or by using the keyword search tool below to find specific information within the annual report.-
 1
1 -
 2
2 -
 3
3 -
 4
4 -
 5
5 -
 6
6 -
 7
7 -
 8
8 -
 9
9 -
 10
10 -
 11
11 -
 12
12 -
 13
13 -
 14
14 -
15
-
16
-
17
-
18
-
19
-
20
-
21
-
22
-
23
-
24
-
25
-
26
-
27
-
28
-
29
-
30
-
31
-
32
-
33
-
34
-
35
-
36
-
37
-
38
-
39
-
40
-
41
-
42
-
43
-
44
-
45
-
46
-
47
-
48
-
49
-
50
-
51
-
52
-
53
-
54
-
55
-
56
-
57
-
58
-
59
-
60
-
61
-
62
-
63
-
64
-
65
-
66
-
67
-
68
-
69
-
70
-
71
-
72
-
73
-
74
-
75
-
76
-
77
-
78
-
79
-
80
-
81
-
82
-
83
-
84
-
85
-
86
-
87
-
88
-
89
-
90
-
91
-
92
-
93
-
94
-
95
-
96
-
97
-
98
-
99
-
100
-
101
-
102
-
103
-
104
-
105
-
106
-
107
-
108
-
109
-
110
-
111
-
112
-
113
-
114
-
115
-
116
 |
 |

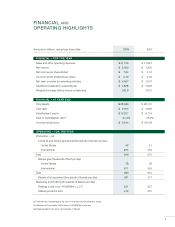
FINANCIAL AND
OPERATING HIGHLIGHTS
(a) Total debt as a percentage of the sum of total debt and stockholders’ equity.
(b) Reflects the Corporation’s 50% share of HOVENSA’s crude runs.
See Management’s Discussion and Analysis of Results.
Amounts in millions, except per share data 2008 2007
FINANCIAL – FOR THE YEAR
Sales and other operating revenues $ 41,165 $ 31,647
Net income $ 2,360 $ 1,832
Net income per share diluted $ 7.24 $ 5.74
Common stock dividends per share $ 0.40 $ 0.40
Net cash provided by operating activities $ 4,567 $ 3,507
Capital and exploratory expenditures $ 4,828 $ 3,926
Weighted average diluted shares outstanding 325.8 319.3
FINANCIAL – AT YEAR END
Total assets $ 28,589 $ 26,131
Total debt $ 3,955 $ 3,980
Stockholders’ equity $ 12,307 $ 9,774
Debt to capitalization ratio(a) 24.3% 28.9%
Common stock price $ 53.64 $ 100.86
OPERATING – FOR THE YEAR
Production – net
Crude oil and natural gas liquids (thousands of barrels per day)
United States 42 41
International 224 234
Total 266 275
Natural gas (thousands of Mcf per day)
United States 78 88
International 611 525
Total 689 613
Barrels of oil equivalent (thousands of barrels per day) 381 377
Marketing and Refining (thousands of barrels per day)
Refining crude runs—HOVENSA L.L.C.(b) 221 227
Refined products sold 472 451
1