Henry Schein 2013 Annual Report Download - page 2
Download and view the complete annual report
Please find page 2 of the 2013 Henry Schein annual report below. You can navigate through the pages in the report by either clicking on the pages listed below, or by using the keyword search tool below to find specific information within the annual report.-
 1
1 -
 2
2 -
 3
3 -
 4
4 -
 5
5 -
 6
6 -
 7
7 -
 8
8 -
 9
9 -
 10
10 -
 11
11 -
 12
12 -
 13
13 -
14
-
15
-
16
-
17
-
18
-
19
-
20
-
21
-
22
-
23
-
24
-
25
-
26
-
27
-
28
-
29
-
30
-
31
-
32
-
33
-
34
-
35
-
36
-
37
-
38
-
39
-
40
-
41
-
42
-
43
-
44
-
45
-
46
-
47
-
48
-
49
-
50
-
51
-
52
-
53
-
54
-
55
-
56
-
57
-
58
-
59
-
60
-
61
-
62
-
63
-
64
-
65
-
66
-
67
-
68
-
69
-
70
-
71
-
72
-
73
-
74
-
75
-
76
-
77
-
78
-
79
-
80
-
81
-
82
-
83
-
84
-
85
-
86
-
87
-
88
-
89
-
90
-
91
-
92
-
93
-
94
-
95
-
96
-
97
-
98
-
99
-
100
-
101
-
102
-
103
-
104
-
105
-
106
-
107
-
108
-
109
-
110
-
111
-
112
-
113
-
114
-
115
-
116
-
117
-
118
-
119
-
120
 |
 |

1
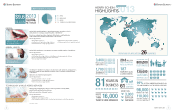
Henry Schein, Inc. is the world’s largest provider
of health care products and services to office-based
dental, animal health and medical practitioners.
The Company also serves dental laboratories, government and
institutional health care clinics, and other alternate care sites. A
FORTUNE
®
500 Company and a member of the NASDAQ
®
100 Index,
Henry Schein employs more than 16,000 Team Schein Members and serves
more than 800,000 customers.
The Company offers a comprehensive selection of products and services,
including value-added solutions for operating efficient practices and
delivering high-quality care. Henry Schein operates through a centralized
and automated distribution network, with a selection of more than 96,000
branded products and Henry Schein private-brand products in stock, as well
as more than 110,000 additional products available as special-order items.
The Company also offers its customers exclusive, innovative technology
solutions, including practice management software and e-commerce
solutions, as well as a broad range of financial services.
Headquartered in Melville, New York, Henry Schein has operations or
affiliates in 26 countries. The Company’s sales reached a record $9.6 billion
in 2013, and have grown at a compound annual rate of approximately 16%
since Henry Schein became a public company in 1995. For more information,
visit the Henry Schein website www.henryschein.com.
(As of March 2014)
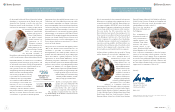
About the cover theme: The global health care services landscape is evolving at a rapid pace, and practitioners,
whether in the dental, animal health or medical market, must keep up with evolving technology and standards of
practice to ensure their long-term success. Henry Schein is committed to providing its customers with high-quality
products, excellent service and expert advice to help them navigate this changing health care landscape. We strive to
be our customers’ first resource for ideas to help generate revenue, reduce costs and invest in solutions to enhance the
long-term success of their practices. Our customers know they can “Rely on Us” to help facilitate the best clinical care
for their patients.
ABOUT HENRY SCHEIN
HENRY SCHEIN 2013
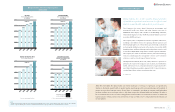
$0
$100
$200
$300
$400
$500
$600
$700
$0
2009
2010
2011
2012
2013
$10,000
$8,000
$6,000
$9,561
$6,538
$7,527
$8,530
$8,940
$4,000
$2,000
$0
$100
$200
$300
$400
$500
$600
$700
$0
$5.00
$4.00
$3.00
$2.00
$1.00
$0
$677
$398 $395
$52 $39
$555
$45
$408
$51
$469
$533
$582
$634
$4.95
$3.20
$3.58
$3.97
$4.44
2009
2010
2011
2012
2013
2009
2010
2011
2012
2013
2009
2010
2011
2012
2013
$664
$60
EARNINGS PER DILUTED SHARE
from Continuing Operations
OPERATING CASH FLOW
AND CAPITAL EXPENDITURES
($ in Millions)
CAGR 12%*
*Four-year Compound Annual Growth Rate
OPERATING CASH FLOW
CAPITAL EXPENDITURES
NET SALES
from Continuing Operations
($ in Millions)
OPERATING INCOME
from Continuing Operations
($ in Millions)
CAGR 10%*
CAGR 10%*
(1)
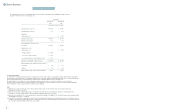
(1) Net of temporary forward inventory buy-ins of $150MM.
NOTE:
Operating Income and Earnings Per Diluted Share from Continuing Operations attributable to Henry Schein, Inc. have been adjusted to exclude certain one-time items. Refer to Non-GAAP
Disclosures on page 12. Additionally, refer to our annual consolidated financial statements for a complete presentation of our Consolidated Statements of Cash Flows.
HENRY SCHEIN FINANCIAL HIGHLIGHTS
2009–2013