Harman Kardon 2008 Annual Report Download - page 3
Download and view the complete annual report
Please find page 3 of the 2008 Harman Kardon annual report below. You can navigate through the pages in the report by either clicking on the pages listed below, or by using the keyword search tool below to find specific information within the annual report.-
 1
1 -
 2
2 -
 3
3 -
 4
4 -
 5
5 -
 6
6 -
 7
7 -
 8
8 -
 9
9 -
 10
10 -
 11
11 -
 12
12 -
 13
13 -
 14
14 -
15
-
16
-
17
-
18
-
19
-
20
-
21
-
22
-
23
-
24
-
25
-
26
-
27
-
28
-
29
-
30
-
31
-
32
-
33
-
34
-
35
-
36
-
37
-
38
-
39
-
40
-
41
-
42
-
43
-
44
-
45
-
46
-
47
-
48
-
49
-
50
-
51
-
52
-
53
-
54
-
55
-
56
-
57
-
58
-
59
-
60
-
61
-
62
-
63
-
64
-
65
-
66
-
67
-
68
-
69
-
70
-
71
-
72
-
73
-
74
-
75
-
76
-
77
-
78
-
79
-
80
-
81
-
82
-
83
-
84
-
85
-
86
-
87
-
88
-
89
-
90
-
91
-
92
-
93
-
94
-
95
-
96
-
97
-
98
-
99
-
100
-
101
-
102
-
103
-
104
-
105
-
106
-
107
-
108
 |
 |

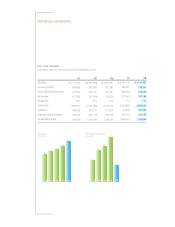
Net Sales
Operating Income
Income Before Income Taxes
Net Income
Diluted EPS
Total Assets
Total Debt
Cash and Cash Equivalents
Shareholders’ Equity
04
$ 2,711,374
254,465
227,520
157,883
2.27
1,999,875
394,925
286,708
874,996
05
$ 3,030,889
350,981
335,337
232,848
3.31
2,201,983
333,917
291,214
1,060,948
06
$ 3,247,897
397,241
376,187
255,295
3.75
2,375,752
197,554
291,758
1,228,164
07
$ 3,551,144
386,387
382,205
313,963
4.72
2,508,868
76,528
106,141
1,494,041
08
$ 4,112,503
138,501
124,484
107,786
1.73
2,826,925
427,952
223,109
1,339,846
(in thousands, except per share data, for the fiscal years ended June 30)
Financial HigHligHts
2.27
3.31
3.75
4.72
1.73
Earnings Per Share
(dilluted)
04 05 06 07 08
04 05 06 07 08
2.71
3.03
3.24
3.55
4.11
Net Sales
(in Billions)