Hamilton Beach 2008 Annual Report Download - page 14
Download and view the complete annual report
Please find page 14 of the 2008 Hamilton Beach annual report below. You can navigate through the pages in the report by either clicking on the pages listed below, or by using the keyword search tool below to find specific information within the annual report.-
 1
1 -
2
-
3
-
 4
4 -
 5
5 -
 6
6 -
 7
7 -
 8
8 -
 9
9 -
 10
10 -
 11
11 -
 12
12 -
 13
13 -
 14
14 -
 15
15 -
 16
16 -
 17
17 -
 18
18
 |
 |
11
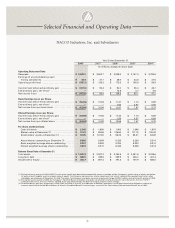
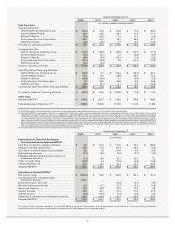
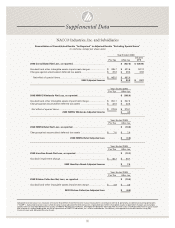
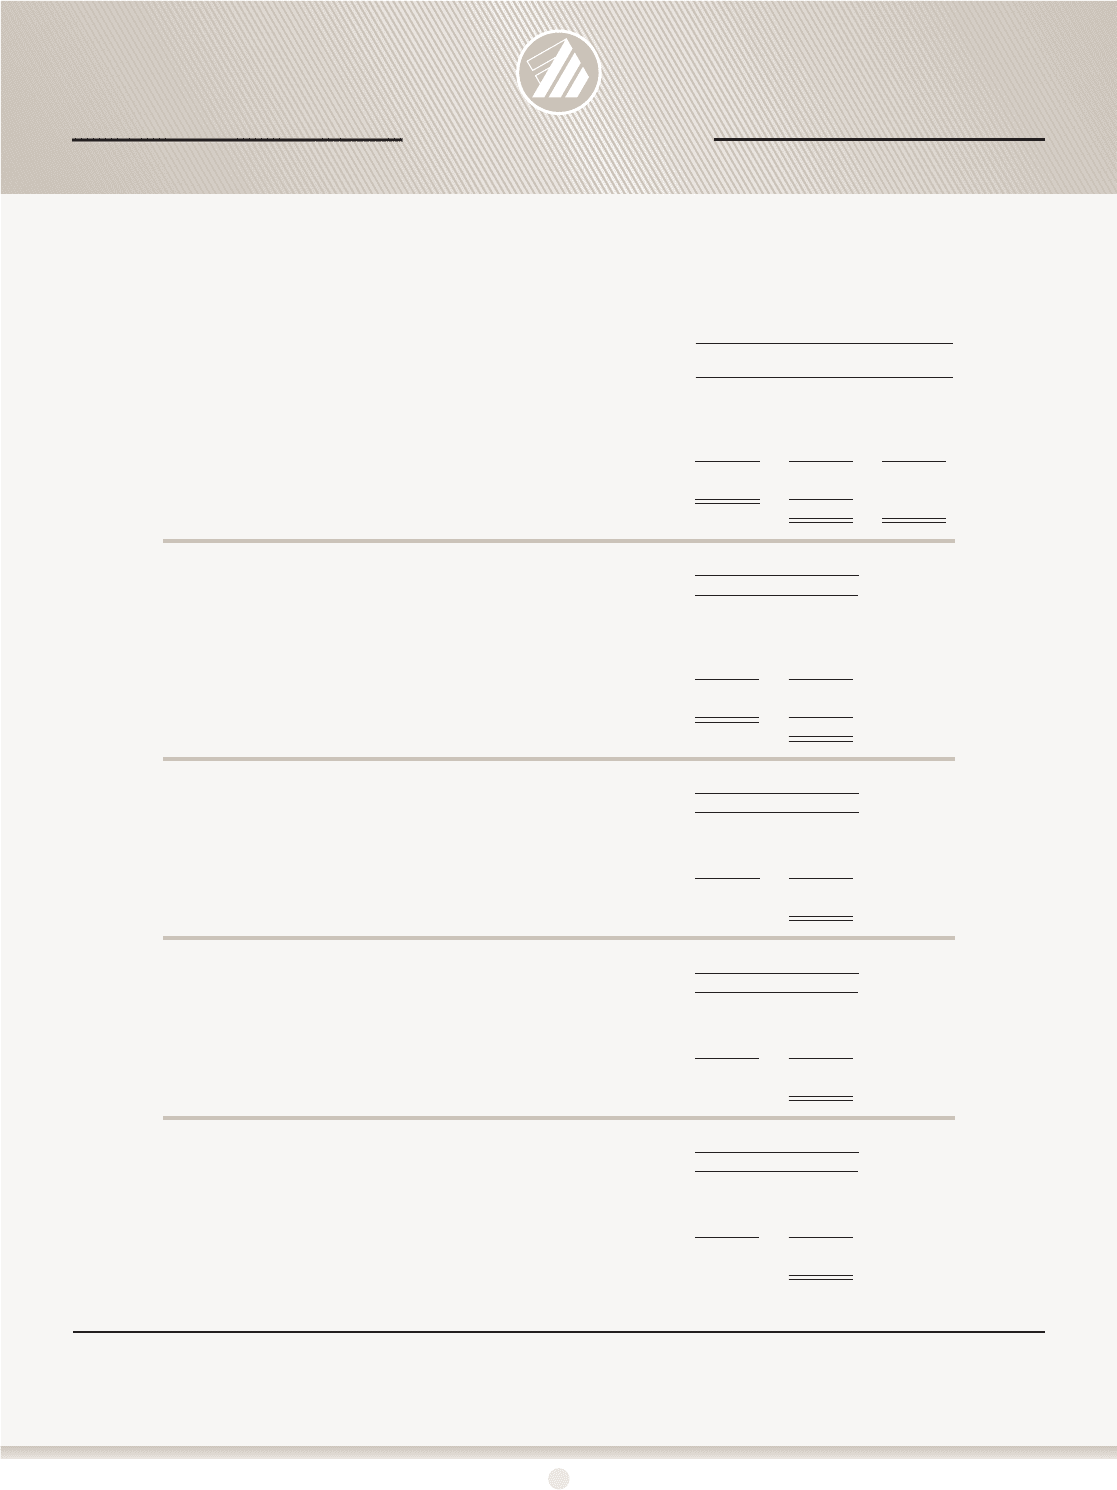
Supplemental Data
2008 Consolidated Net Loss, as reported. . . . . . . . . . . . . . . . . . . . . . . . . . .
Goodwill and other intangible assets impairment charges . . . . . . . . . . . .
Charges against accumulated deferred tax assets. . . . . . . . . . . . . . . . . . . .
Net effect of special items
. . . . . . . . . . . . . . . . . . . . . . . . . . . . . . . . . . . . .
2008 Adjusted Income
$ (437.6)
$ 431.6
$ 29.8
$ 461.4
$ 23.8
$ 435.7
$ 29.8
$ 465.5
$ (52.84)
52.12
3.59
$ 2.87
Diluted
Pre-Tax After-tax EPS
Year Ended 2008
2008 NMHG Wholesale Net Loss, as reported. . . . . . . . . . . . . . . . . . . . . . .
Goodwill and other intangible assets impairment charge . . . . . . . . . . . . .
Charge against accumulated deferred tax assets . . . . . . . . . . . . . . . . . . . .
Net effect of special items
. . . . . . . . . . . . . . . . . . . . . . . . . . . . . . . . . . . . . .
2008 NMHG Wholesale Adjusted Income
Pre-Tax After-tax
Year Ended 2008
$ (365.6)
$ 347.3
$ 22.8
$ 370.1
$ 4.5
$ 351.1
$ 22.8
$ 373.9
2008 NMHG Retail Net Loss, as reported. . . . . . . . . . . . . . . . . . . . . . . . . . .
Charge against accumulated deferred tax assets . . . . . . . . . . . . . . . . . . . .
2008 NMHG Retail Adjusted Loss
Pre-Tax After-tax
Year Ended 2008
$ (10.4)
$ 7.0
$ (3.4)
$ 7.0
2008 Hamilton Beach Net Loss, as reported . . . . . . . . . . . . . . . . . . . . . . . .
Goodwill impairment charge . . . . . . . . . . . . . . . . . . . . . . . . . . . . . . . . . . . . .
2008 Hamilton Beach Adjusted Income
Pre-Tax After-tax
Year Ended 2008
$ (73.3)
$ 80.7
$ 7.4
$ 80.7
2008 Kitchen Collection Net Loss, as reported . . . . . . . . . . . . . . . . . . . . . .
Goodwill and other intangible assets impairment charge . . . . . . . . . . . . .
2008 Kitchen Collection Adjusted Loss
Pre-Tax After-tax
Year Ended 2008
$ (10.0)
$ 3.6
$ (6.4)
$ 3.9
Reconciliation of Consolidated Results “As Reported” to Adjusted Results “Excluding Special Items”
(in millions, except per share data)
NACCO Industries, Inc. and Subsidiaries
Adjusted Income (Loss) is a measure of income that differs from Net Income (Loss) measured in accordance with U.S. generally accepted accounting principles
(“GAAP”). Adjusted Income (Loss) is Net Income (Loss) adjusted for the exclusion of goodwill and other intangible assets impairment charges and charges
against the accumulated deferred tax assets of NMHG Wholesale and Retail. Management believes that both Net Income (Loss) and Adjusted Income (Loss) assist
the investor in understanding the results of operations of NACCO Industries, Inc. and its subsidiaries. In addition, management evaluates results using Net
Income (Loss) and Adjusted Income (Loss).