Google 2015 Annual Report Download - page 75
Download and view the complete annual report
Please find page 75 of the 2015 Google annual report below. You can navigate through the pages in the report by either clicking on the pages listed below, or by using the keyword search tool below to find specific information within the annual report.-
 1
1 -
2
-
3
-
4
-
5
-
6
-
7
-
8
-
9
-
10
-
11
-
12
-
13
-
14
-
15
-
16
-
17
-
18
-
19
-
20
-
21
-
22
-
23
-
24
-
25
-
26
-
27
-
28
-
29
-
30
-
31
-
32
-
33
-
34
-
35
-
36
-
37
-
38
-
39
-
40
-
41
-
42
-
43
-
44
-
45
-
46
-
47
-
48
-
49
-
50
-
51
-
52
-
53
-
54
-
55
-
56
-
57
-
58
-
59
-
60
-
61
-
62
-
63
-
64
-
 65
65 -
 66
66 -
 67
67 -
 68
68 -
 69
69 -
 70
70 -
 71
71 -
 72
72 -
 73
73 -
 74
74 -
 75
75 -
 76
76 -
 77
77 -
 78
78 -
 79
79 -
 80
80 -
 81
81 -
 82
82 -
 83
83 -
 84
84 -
 85
85 -
86
-
87
-
88
-
89
-
90
-
91
-
92
-
93
-
94
-
95
-
96
-
97
-
98
-
99
-
100
-
101
-
102
-
103
-
104
-
105
-
106
-
107
-
108
-
109
-
110
-
111
-
112
-
113
-
114
-
115
-
116
-
117
-
118
-
119
-
120
-
121
-
122
-
123
-
124
-
125
-
126
-
127
 |
 |
Table of Contents Alphabet Inc. and Google Inc.
71
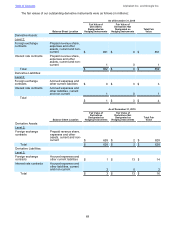
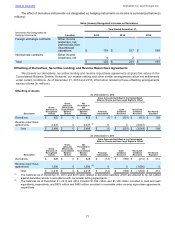
The effect of derivative instruments not designated as hedging instruments on income is summarized below (in
millions):
Gains (Losses) Recognized in Income on Derivatives
Year Ended December 31,
Derivatives Not Designated As
Hedging Instruments Location 2013 2014 2015
Foreign exchange contracts Other income
(expense), net,
and net loss from
discontinued
operations $ 118 $ 237 $ 198
Interest rate contracts Other income
(expense), net 42 1
Total $ 122 $ 239 $ 199
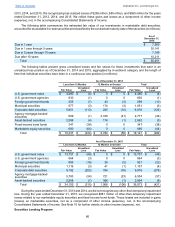
Offsetting of Derivatives, Securities Lending, and Reverse Repurchase Agreements
We present our derivatives, securities lending and reverse repurchase agreements at gross fair values in the
Consolidated Balance Sheets. However, our master netting and other similar arrangements allow net settlements
under certain conditions. As of December 31, 2014 and 2015, information related to these offsetting arrangements
was as follows (in millions):
Offsetting of Assets
As of December 31, 2014
Gross Amounts Not Offset in the Consolidated
Balance Sheets, but Have Legal Rights to Offset
Description
Gross
Amounts of
Recognized
Assets
Gross
Amounts
Offset in the
Consolidated
Balance
Sheets
Net
Presented in
the
Consolidated
Balance
Sheets Financial
Instruments
Cash
Collateral
Received
Non-Cash
Collateral
Received Net Assets
Exposed
Derivatives $ 852 $ 0 $ 852 $ (1) (1) $ (251) $ (412) $ 188
Reverse repurchase
agreements 2,637 0 2,637 (2) 0 0 (2,637) 0
Total $ 3,489 $ 0 $ 3,489 $ (1) $ (251) $ (3,049) $ 188
As of December 31, 2015
Gross Amounts Not Offset in the Consolidated
Balance Sheets, but Have Legal Rights to Offset
Description
Gross
Amounts of
Recognized
Assets
Gross
Amounts
Offset in the
Consolidated
Balance
Sheets
Net
Presented in
the
Consolidated
Balance
Sheets Financial
Instruments
Cash
Collateral
Received
Non-Cash
Collateral
Received Net Assets
Exposed
Derivatives $ 628 $ 0 $ 628 $ (13) (1) $ (189) $ (214) $ 212
Reverse repurchase
agreements 1,590 0 1,590 (2) 0 0 (1,590) 0
Total $ 2,218 $ 0 $ 2,218 $ (13) $ (189) $ (1,804) $ 212
(1) The balances as of December 31, 2014 and 2015 were related to derivative liabilities which are allowed to be net settled
against derivative assets in accordance with our master netting agreements.
(2) The balances as of December 31, 2014 and 2015 included $1,762 million and $1,140 million recorded in cash and cash
equivalents, respectively, and $875 million and $450 million recorded in receivable under reverse repurchase agreements,
respectively.