Google 2015 Annual Report Download - page 64
Download and view the complete annual report
Please find page 64 of the 2015 Google annual report below. You can navigate through the pages in the report by either clicking on the pages listed below, or by using the keyword search tool below to find specific information within the annual report.-
 1
1 -
2
-
3
-
4
-
5
-
6
-
7
-
8
-
9
-
10
-
11
-
12
-
13
-
14
-
15
-
16
-
17
-
18
-
19
-
20
-
21
-
22
-
23
-
24
-
25
-
26
-
27
-
28
-
29
-
30
-
31
-
32
-
33
-
34
-
35
-
36
-
37
-
38
-
39
-
40
-
41
-
42
-
43
-
44
-
45
-
46
-
47
-
48
-
49
-
50
-
51
-
52
-
53
-
 54
54 -
 55
55 -
 56
56 -
 57
57 -
 58
58 -
 59
59 -
 60
60 -
 61
61 -
 62
62 -
 63
63 -
 64
64 -
 65
65 -
 66
66 -
 67
67 -
 68
68 -
 69
69 -
 70
70 -
 71
71 -
 72
72 -
 73
73 -
 74
74 -
75
-
76
-
77
-
78
-
79
-
80
-
81
-
82
-
83
-
84
-
85
-
86
-
87
-
88
-
89
-
90
-
91
-
92
-
93
-
94
-
95
-
96
-
97
-
98
-
99
-
100
-
101
-
102
-
103
-
104
-
105
-
106
-
107
-
108
-
109
-
110
-
111
-
112
-
113
-
114
-
115
-
116
-
117
-
118
-
119
-
120
-
121
-
122
-
123
-
124
-
125
-
126
-
127
 |
 |

Table of Contents Alphabet Inc. and Google Inc.
60
evidence of fair value (VSOE), (ii) third-party evidence of selling price, and (iii) best estimate of the selling price (ESP).
VSOE generally exists only when we sell the deliverable separately and is the price actually charged by us for that
deliverable. ESPs reflect our best estimates of what the selling price of the deliverable would be if it was sold regularly
on a stand-alone basis.
We record deferred revenues when cash payments are received in advance of our performance in the underlying
agreement on the accompanying Consolidated Balance Sheets.
Cost of Revenues
Cost of revenues consists of traffic acquisition costs which are the advertising revenues shared with our Google
Network Members and the amounts paid to our distribution partners who distribute our browser or otherwise direct
search queries to our website.
Additionally, other costs of revenues includes the following:
• The expenses associated with the operation of our data centers (including depreciation, labor, energy, and
bandwidth costs);
• Content acquisition costs primarily related to payments to certain content providers from whom we license
their video and other content for distribution on YouTube and Google Play (we share most of the fees these
sales generate with content providers or pay a fixed fee to these content providers);
• Credit card and other transaction fees related to processing customer transactions;
• Stock-based compensation expense;
• Revenue share payments to mobile carriers;
• Inventory costs for hardware we sell; and
• Amortization of certain intangible assets.
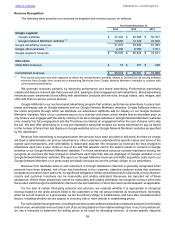
Stock-based Compensation
Restricted stock units (RSUs) are measured based on the fair market value of the underlying stock on the date
of grant. Shares are issued on the vesting dates net of the minimum statutory tax withholding to be paid by us on
behalf of our employees. As a result, the actual number of shares issued will be fewer than the actual number of RSUs
outstanding. We record the liability for withholding amounts to be paid by us primarily as a reduction to additional paid-
in capital when paid.
For stock option awards, we determined fair value using the Black-Scholes-Merton (BSM) option pricing model
on the date of grant.
Stock-based compensation includes awards we expect to settle in Alphabet stock as well as awards we will
ultimately settle in cash. We recognize stock-based compensation, less an estimate for forfeitures, using the straight-
line method over the requisite service period. Additionally, stock-based compensation for liability classified awards
reflect changes in fair value during the requisite service period.
We include as part of cash flows from financing activities the benefits of tax deductions in excess of the tax-
effected compensation of the related stock-based awards for options exercised and RSUs vested during the period.
During the years ended December 31, 2013, 2014, and 2015, the amount of cash received from the exercise of stock
options was $1,174 million, $465 million, and $393 million, respectively.
We have elected to account for the indirect effects of stock-based awards -- primarily the research and
development tax credit -- through the Consolidated Statements of Income. Total direct tax benefit realized, including
the excess tax benefit, from stock-based award activities during the years ended December 31, 2013, 2014, and 2015,
was $1,195 million, $1,356 million, and $1,544 million, respectively.
Certain Risks and Concentrations
Our revenues are primarily derived from online advertising, the market for which is highly competitive and rapidly
changing. In addition, our revenues are generated from a multitude of vertical market segments in countries around
the world. Significant changes in this industry or changes in customer buying or advertiser spending behavior could
adversely affect our operating results.
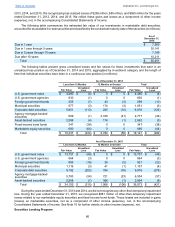
We are subject to concentrations of credit risk principally from cash and cash equivalents, marketable securities,
foreign exchange contracts, and accounts receivable. Cash equivalents and marketable securities consist primarily
of time deposits, money market and other funds, including cash collateral received related to our securities lending
program, highly liquid debt instruments of the U.S. government and its agencies, debt instruments issued by foreign
governments and municipalities in the U.S., corporate securities, agency mortgage-backed securities, and asset-
backed securities. Foreign exchange contracts are transacted with various financial institutions with high credit standing.