Goldman Sachs 2007 Annual Report Download - page 11
Download and view the complete annual report
Please find page 11 of the 2007 Goldman Sachs annual report below. You can navigate through the pages in the report by either clicking on the pages listed below, or by using the keyword search tool below to find specific information within the annual report.-
 1
1 -
 2
2 -
 3
3 -
 4
4 -
 5
5 -
 6
6 -
 7
7 -
 8
8 -
 9
9 -
 10
10 -
 11
11 -
 12
12 -
 13
13 -
 14
14 -
 15
15 -
 16
16 -
 17
17 -
 18
18 -
 19
19 -
 20
20 -
 21
21 -
 22
22 -
23
-
24
-
25
-
26
-
27
-
28
-
29
-
30
-
31
-
32
-
33
-
34
-
35
-
36
-
37
-
38
-
39
-
40
-
41
-
42
-
43
-
44
-
45
-
46
-
47
-
48
-
49
-
50
-
51
-
52
-
53
-
54
-
55
-
56
-
57
-
58
-
59
-
60
-
61
-
62
-
63
-
64
-
65
-
66
-
67
-
68
-
69
-
70
-
71
-
72
-
73
-
74
-
75
-
76
-
77
-
78
-
79
-
80
-
81
-
82
-
83
-
84
-
85
-
86
-
87
-
88
-
89
-
90
-
91
-
92
-
93
-
94
-
95
-
96
-
97
-
98
-
99
-
100
-
101
-
102
-
103
-
104
-
105
-
106
-
107
-
108
-
109
-
110
-
111
-
112
-
113
-
114
-
115
-
116
-
117
-
118
-
119
-
120
-
121
-
122
-
123
-
124
-
125
-
126
-
127
-
128
-
129
-
130
-
131
-
132
-
133
-
134
-
135
-
136
-
137
-
138
-
139
-
140
-
141
-
142
-
143
-
144
-
145
-
146
-
147
-
148
-
149
-
150
-
151
-
152
-
153
-
154
 |
 |

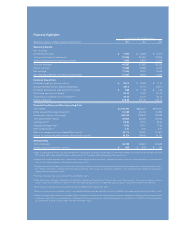
Financial Highlights
As of or for the Year Ended November
($ and share amounts in millions, except per share amounts) 2007 2006 2005
Operating Results
Net revenues
Investment banking $ 7,555 $ 5,629 $ 3,671
Trading and principal investments 31,226 25,562 16,818
Asset management and securities services 7,206 6,474 4,749
Total net revenues 45,987 37,665 25,238
Pre-tax earnings 17,604 14,560 8,273
Net earnings 11,599 9,537 5,626
Net earnings applicable to common shareholders 11,407 9,398 5,609
Common Share Data
Diluted earnings per common share $ 24.73 $ 19.69 $ 11.21
Average diluted common shares outstanding 461.2 477.4 500.2
Dividends declared and paid per common share $ 1.40 $ 1.30 $ 1.00
Book value per common share
(1) 90.43 72.62 57.02
Tangible book value per common share
(2) (3) 78.88 61.47 46.76
Ending stock price 226.64 201.60 134.12
Financial Condition and Other Operating Data
Total assets $1,119,796 $838,201 $706,804
Other secured financings (long-term) 33,300 26,134 15,669
Unsecured long-term borrowings 164,174 122,842 84,338
Total shareholders’ equity 42,800 35,786 28,002
Leverage ratio
(4) 26.2x 23.4x 25.2x
Adjusted leverage ratio
(5) 17.5x 16.1x 17.9x
Debt to equity ratio
(6) 3.8x 3.4x 3.0x
Return on average common shareholders’ equity
(7) 32.7% 32.8% 21.8%
Return on average tangible common shareholders’ equity
(8) 38.2% 39.8% 26.7%
Selected Data
Total employees 30,522 26,467 23,623
Assets under management (in billions) $ 868 $ 676 $ 532
(1)
Book value per common share is based on common shares outstanding, including restricted stock units granted to employees with no future service requirements, of
439.0 million, 450.1 million and 460.4 million as of November 2007, November 2006 and November 2005, respectively.
(2)
Tangible book value per common share is computed by dividing tangible common shareholders’ equity by the number of common shares outstanding, including restricted
stock units granted to employees with no future service requirements.
(3)
Tangible common shareholders’ equity equals total shareholders’ equity less preferred stock, goodwill and identifiable intangible assets, excluding power contracts.
See “Financial Information
—
Management’s Discussion and Analysis
—
Equity Capital
—
Capital Ratios and Metrics” for further information regarding our calculation of
tangible common shareholders’ equity.
(4)
Leverage ratio equals total assets divided by total shareholders’ equity.
(5)
Adjusted leverage ratio equals adjusted assets divided by tangible equity capital. See “Financial Information
—
Management’s Discussion and Analysis
—
Equity
Capital
—
Capital Ratios and Metrics” for further information regarding adjusted assets, tangible equity capital and our calculation of the adjusted leverage ratio.
(6)
Debt to equity ratio equals unsecured long-term borrowings divided by total shareholders’ equity.
(7)
Return on average common shareholders’ equity is computed by dividing net earnings applicable to common shareholders by average monthly common shareholders’ equity.
(8)
Return on average tangible common shareholders’ equity is computed by dividing net earnings applicable to common shareholders by average monthly tangible common
shareholders’ equity. See “Financial Information
—
Management’s Discussion and Analysis
—
Results of Operations
—
Financial Overview” for further information regarding
our calculation of return on average tangible common shareholders’ equity.