Freeport-McMoRan 2013 Annual Report Download - page 2
Download and view the complete annual report
Please find page 2 of the 2013 Freeport-McMoRan annual report below. You can navigate through the pages in the report by either clicking on the pages listed below, or by using the keyword search tool below to find specific information within the annual report.-
 1
1 -
 2
2 -
 3
3 -
 4
4 -
 5
5 -
 6
6 -
 7
7 -
 8
8 -
 9
9 -
 10
10 -
 11
11 -
 12
12 -
 13
13 -
14
-
15
-
16
-
17
-
18
-
19
-
20
-
21
-
22
-
23
-
24
-
25
-
26
-
27
-
28
-
29
-
30
-
31
-
32
-
33
-
34
-
35
-
36
-
37
-
38
-
39
-
40
-
41
-
42
-
43
-
44
-
45
-
46
-
47
-
48
-
49
-
50
-
51
-
52
-
53
-
54
-
55
-
56
-
57
-
58
-
59
-
60
-
61
-
62
-
63
-
64
-
65
-
66
-
67
-
68
-
69
-
70
-
71
-
72
-
73
-
74
-
75
-
76
-
77
-
78
-
79
-
80
-
81
-
82
-
83
-
84
-
85
-
86
-
87
-
88
-
89
-
90
-
91
-
92
-
93
-
94
-
95
-
96
-
97
-
98
-
99
-
100
-
101
-
102
-
103
-
104
-
105
-
106
-
107
-
108
-
109
-
110
-
111
-
112
-
113
-
114
-
115
-
116
-
117
-
118
-
119
-
120
-
121
-
122
-
123
-
124
-
125
-
126
-
127
-
128
-
129
-
130
-
131
-
132
-
133
-
134
-
135
-
136
-
137
-
138
 |
 |

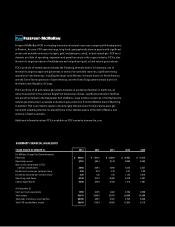
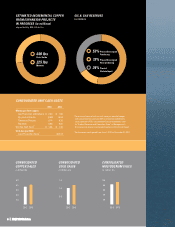
YEARS ENDED DECEMBER 31, 2013 2012 2011 2010 2009
(In Millions, Except Per Share Amounts)
Revenues $ 20,921 $ 18,010 $ 20,880 $ 18,982 $ 15,040
Operating income 5,351 5,814 9,140 9,068 6,503
Net income attributable to FCX
common stockholders 2,658 3,041 4,560 4,273 2,527
Diluted net income per common share 2.64 3.19 4.78 4.57 2.93
Dividends declared per common share 2.25 1.25 1.50 1.125 0.075
Operating cash flows 6,139 3,774 6,620 6,273 4,397
Capital expenditures 5,286 3,494 2,534 1,412 1,587
At December 31:
Cash and cash equivalents 1,985 3,705 4,822 3,738 2,656
Total assets 63,473 35,440 32,070 29,386 25,996
Total debt, including current portion 20,706 3,527 3,537 4,755 6,346
Total FCX stockholders’ equity 20,934 17,543 15,642 12,504 9,119
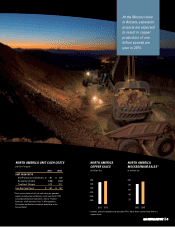
Freeport-McMoRan (FCX) is a leading international natural resources company with headquarters
in Phoenix, Arizona. FCX operates large, long-lived, geographically diverse assets with signicant
proven and probable reserves of copper, gold, molybdenum, cobalt, oil and natural gas. FCX has a
dynamic portfolio of operating, expansion and growth projects in the copper industry. FCX is also
the world’s largest producer of molybdenum and a signicant gold, oil and natural gas producer.
FCX’s portfolio of metals assets includes the Grasberg minerals district in Indonesia, one of
the world’s largest copper and gold mines in terms of recoverable reserves; signicant mining
operations in the Americas, including the large-scale Morenci minerals district in North America
and the Cerro Verde operation in South America; and the Tenke Fungurume minerals district in
the Democratic Republic of Congo.
FCX’s portfolio of oil and natural gas assets includes oil production facilities in California, an
attractive position in the onshore Eagle Ford shale play in Texas, signicant production facilities
and growth potential in the Deepwater Gulf of Mexico, large onshore resources in the Haynesville
natural gas shale play in Louisiana and natural gas production from the Madden area in Wyoming.
In addition, FCX is an industry leader in the emerging Inboard Lower Tertiary/Cretaceous gas
trend with sizeable potential, located offshore in the shallow waters of the Gulf of Mexico and
onshore in South Louisiana.
Additional information about FCX is available on FCX’s website at www.fcx.com.
SUMMARY FINANCIAL HIGHLIGHTS