Freeport-McMoRan 2013 Annual Report Download
Download and view the complete annual report
Please find the complete 2013 Freeport-McMoRan annual report below. You can navigate through the pages in the report by either clicking on the pages listed below, or by using the keyword search tool below to find specific information within the annual report.-
 1
1 -
 2
2 -
 3
3 -
 4
4 -
 5
5 -
 6
6 -
 7
7 -
 8
8 -
 9
9 -
 10
10 -
 11
11 -
 12
12 -
13
-
14
-
15
-
16
-
17
-
18
-
19
-
20
-
21
-
22
-
23
-
24
-
25
-
26
-
27
-
28
-
29
-
30
-
31
-
32
-
33
-
34
-
35
-
36
-
37
-
38
-
39
-
40
-
41
-
42
-
43
-
44
-
45
-
46
-
47
-
48
-
49
-
50
-
51
-
52
-
53
-
54
-
55
-
56
-
57
-
58
-
59
-
60
-
61
-
62
-
63
-
64
-
65
-
66
-
67
-
68
-
69
-
70
-
71
-
72
-
73
-
74
-
75
-
76
-
77
-
78
-
79
-
80
-
81
-
82
-
83
-
84
-
85
-
86
-
87
-
88
-
89
-
90
-
91
-
92
-
93
-
94
-
95
-
96
-
97
-
98
-
99
-
100
-
101
-
102
-
103
-
104
-
105
-
106
-
107
-
108
-
109
-
110
-
111
-
112
-
113
-
114
-
115
-
116
-
117
-
118
-
119
-
120
-
121
-
122
-
123
-
124
-
125
-
126
-
127
-
128
-
129
-
130
-
131
-
132
-
133
-
134
-
135
-
136
-
137
-
138
 |
 |

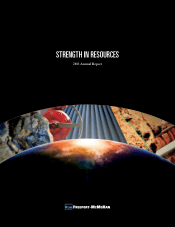
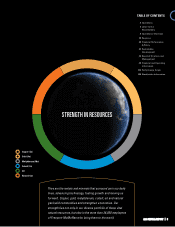
STRENGTH IN RESOURCES
2013 Annual Report
Table of contents
-
Page 1
STRENGTH IN RESOURCES 2013 Annual Report -
Page 2
... in North America and the Cerro Verde operation in South America; and the Tenke Fungurume minerals district in the Democratic Republic of Congo. FCX's portfolio of oil and natural gas assets includes oil production facilities in California, an attractive position in the onshore Eagle Ford shale play... -
Page 3
... Financial Performance & Policy 22 Sustainable Development 24 Board of Directors and Management 25 Financial and Operating Information 134 Performance Graph 135 Stockholder Information STRENGTH IN RESOURCES Copper (Cu) Gold (Au) Molybdenum (Mo) Cobalt (Co) Oil Natural Gas They are the metals and... -
Page 4
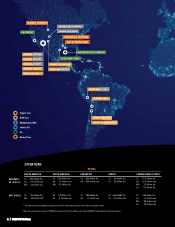
... SHELF DEEPWATER GULF OF MEXICO MORENCI, ARIZONA SIERRITA, ARIZONA BAGDAD, ARIZONA SAFFORD, ARIZONA MIAMI, ARIZONA EAGLE FORD, TEXAS TYRONE, NEW MEXICO CHINO, NEW MEXICO CERRO VERDE, PERU EL ABRA, CHILE Copper (Cu) Gold (Au) Molybdenum (Mo) Cobalt (Co) Oil Natural Gas CANDELARIA, CHILE OJOS DEL... -
Page 5
... cash returns to shareholders. We reported strong operational performance globally and increased our copper production in each of the four geographic regions of our mining business. We also beneï¬ted from a signiï¬cant contribution from oil and gas assets acquired during 2013, which provide a high... -
Page 6
... Board RICHARD C. ADKERSON Vice Chairman of the Board President and Chief Executive Officer JAMES C. FLORES Vice Chairman of the Board President and Chief Executive Officer Freeport-McMoRan Oil & Gas LLC March 20, 2014 Photo: Mill/Concentrator expansion at Cerro Verde, Peru 4 | FREEPORT-McMoRan -
Page 7
LETTER TO OUR SHAREHOLDERS 5 -
Page 8
... 825 million lbs OIL & GAS RESERVES 464 MMBOE 600 lbs Cerro Verde 53% Proved Developed Producing 225 lbs Morenci 13% Proved Developed Non-producing 34% Proved Undeveloped CONSOLIDATED UNIT CASH COSTS 2012 Mining (per lb of copper) Site Production and Delivery $ 2.00 By-product Credits (0.69... -
Page 9
....85 per pound) were higher than 2012 sales of 83 million pounds (at an average realized price of $14.26 per pound), reï¬,ecting a full year of production from the Climax molybdenum mine. Oil and gas sales volumes for the seven-month period in 2013 following the acquisitions totaled 38.1 MMBOE (at an... -
Page 10
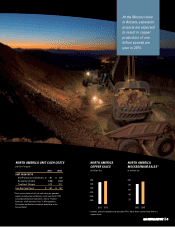
... of copper and molybdenum. In North America, FCX currently operates seven open-pit copper mines - Morenci, Bagdad, Sierrita, Safford and Miami in Arizona, and Chino and Tyrone in New Mexico, and two molybdenum mines - Henderson and Climax in Colorado. Certain of FCX's North America copper mines also... -
Page 11
...'s consolidated financial statements, refer to "Product Revenues and Production Costs" in Management's Discussion and Analysis contained elsewhere in this Annual Report. 2012 2013 * Includes sales of molybdenum produced at FCX's North America and South America copper mines. 2013 ANNUAL REPORT | 9 -
Page 12
...OVERVIEW SOUTH AMERICA MINING FCX operates four copper mines in South America - Cerro Verde in Peru, and El Abra, Candelaria and Ojos del Salado in Chile. In addition to copper, the Cerro Verde mine also produces molybdenum concentrates, and the Candelaria and Ojos del Salado mines produce gold and... -
Page 13
...at Cerro Verde, Peru, and potential new sulfide deposits at El Abra, Chile. SOUTH AMERICA UNIT CASH COSTS per lb of copper 2012 UNIT CASH COSTS Site Production and Delivery $ 1.60 By-product Credits (0.26) Treatment Charges 0.16 Unit Net Cash Costs * SOUTH AMERICA COPPER SALES in billion lbs 2013... -
Page 14
...a reconciliation of unit net cash costs per pound of copper to production and delivery costs reported in FCX's consolidated financial statements, refer to "Product Revenues and Production Costs" in Management's Discussion and Analysis contained elsewhere in this Annual Report. 12 | FREEPORT-McMoRan -
Page 15
... higher ore grades and increased mill rates. To date in 2014, PT Freeport Indonesia has operated at a reduced rate because of export restrictions on international concentrate sales. FCX is working with Indonesian government ofï¬cials to resolve this matter. INDONESIA COPPER RESERVES BY MINE 30... -
Page 16
... operates the copper and cobalt mining concessions in the Tenke Fungurume minerals district in the Katanga province of the Democratic Republic of Congo. TFM completed a second phase expansion project in early 2013, which included optimizing the current plant and increasing mine, mill and processing... -
Page 17
... expansion resulted in record sales of copper in 2013. AFRICA UNIT CASH COSTS per lb of copper 2012 UNIT CASH COSTS Site Production and Delivery $ 1.49 By-product Credits (0.33) Royalties 0.07 Unit Net Cash Costs* $ 1.23 2013 $ 1.43 (0.29) 0.07 $ 1.21 AFRICA COPPER SALES in billion lbs AFRICA... -
Page 18
... international natural resources company. OIL & GAS MARGINS BY REGION †CALIFORNIA OPERATING MARGIN Realized Revenue per BOE* $ 93.95 Cash Production Costs per BOE* 32.33 Cash Operating Margin per BOE †OIL & GAS SALES in MMBOE EAGLE HAYNESVILLE/ GULF OF FORD MADDEN/OTHER MEXICO CONSOLIDATED... -
Page 19
... GAS OPERATIONS During second-quarter 2013, FCX completed the acquisitions of Plains Exploration & Production Company (PXP) and McMoRan Exploration Co. (MMR). FCX's portfolio of oil and gas assets includes oil production facilities and growth potential in the Deepwater Gulf of Mexico, oil production... -
Page 20
... pound)*. FCX continues to pursue opportunities to convert this mineralized material into reserves, future production and cash ï¬,ow. CONSOLIDATED COPPER RESERVES BREAKDOWN* 33% North America 33% South America 27% Indonesia 7% Africa 18 | FREEPORT-McMoRan * Mineralized material is not included... -
Page 21
RESERVES OIL & GAS RESERVES FCX's oil and gas operations have signiï¬cant proved, probable and possible reserves (3P reserves) with ï¬nancially attractive organic growth opportunities. All of FCX's oil and natural gas reserves are located in the United States. At December 31, 2013, FCX's 3P ... -
Page 22
... for a supplemental dividend of $1.00 per share paid in July 2013. FCX's current annual dividend rate for its common stock is $1.25 per share ( $ 0.3125 per share quarterly). 20 | FREEPORT-McMoRan Photo: A Freeport-McMoRan Oil & Gas production facility at the Eagle Ford onshore shale oil play in... -
Page 23
... through common stock dividends. FCX intends to continue to maintain a strong ï¬nancial position, with a focus on reducing debt while continuing to invest in attractive growth projects and providing cash returns to shareholders. The Board of Directors will continue to review FCX's ï¬nancial... -
Page 24
... a global scale. To supply our products to current and future generations, FCX relies on its stated business objectives, principles and policies, and strives to continuously improve its sustainable development programs. FCX reports the sustainability performance of its mining operations according to... -
Page 25
Our Cerro Verde mine in Peru anchors a partnership that will ultimately provide clean water for 750,000 residents of Arequipa, an example of our commitment to maximize the contributions that mining can bring to local communities. 2013 COMMUNITY INVESTMENT $173 million 27% Community Trust Funds 22%... -
Page 26
... James C. Flores Vice Chairman of the Board President and Chief Executive Officer Freeport-McMoRan Oil & Gas LLC Michael J. Arnold Executive Vice President and Chief Administrative Officer Kathleen L. Quirk Executive Vice President, Chief Financial Officer and Treasurer * * * MINING OPERATIONS... -
Page 27
... of Income 80 Consolidated Statements of Comprehensive Income 81 Consolidated Statements of Cash Flows 82 Consolidated Balance Sheets 83 Consolidated Statements of Equity 84 Notes to Consolidated Financial Statements STRENGTH IN RESOURCES FINANCIAL AND OPERATING INFORMATION 2013 ANNUAL REPORT | 25 -
Page 28
... shares outstanding Dividends declared per share of common stock Operating cash flows i Capital expenditures At December 31: Cash and cash equivalents Property, plant, equipment and mining development costs, net Oil and gas properties, net Goodwill Total assets Total debt, including current portion... -
Page 29
...) Mill operations Ore milled (metric tons per day) Average ore grade (percent): Copper Molybdenum Copper recovery rate (percent) Copper production (millions of recoverable pounds) SOUTH AMERICA MINING Copper (recoverable) Production (millions of pounds) Production (thousands of metric tons) Sales... -
Page 30
...2009 SOUTH AMERICA MINING (continued) Mill operations Ore milled (metric tons per day) Average ore grade: Copper (percent) Gold (grams per metric ton) Molybdenum (percent) Copper recovery rate (percent) Copper production (millions of recoverable pounds) INDONESIA MINING Operating Data, Net of Joint... -
Page 31
... AND OPERATING DATA Years Ended December 31, 2013 2012 2011 2010 2009 MOLYBDENUM MINES Molybdenum production (millions of recoverable pounds) Ore milled (metric tons per day)d Average molybdenum ore grade (percent)d OIL AND GAS OPERATIONSe Sales volumes: Oil (million barrels) Natural gas... -
Page 32
... copper and gold deposits, signiï¬cant mining operations in North and South America, the Tenke Fungurume (Tenke) minerals district in the Democratic Republic of Congo (DRC) in Africa and signiï¬cant oil and natural gas assets in North America, including reserves in the Deepwater Gulf of Mexico... -
Page 33
... operations. Sales Volumes. Following are our projected consolidated sales volumes for 2014 and actual consolidated sales volumes for 2013: 2014 (Projected) 2013 (Actual) Copper (millions of recoverable pounds): North America copper mines South America mining Indonesia mining Africa mining Gold... -
Page 34
... industrialized countries, the timing of the development of new supplies of copper and production levels of mines and copper smelters. The LME spot copper price closed at $3.25 per pound on February 14, 2014. MARKETS Metals. World prices for copper, gold and molybdenum can ï¬,uctuate signiï¬cantly... -
Page 35
... 1 under the subheading "Use of Estimates." Management has reviewed the following discussion of its development and selection of critical accounting estimates with the Audit Committee of our Board. Oil and Gas. Market prices for crude oil and natural gas can ï¬,uctuate signiï¬cantly. During the... -
Page 36
... of our existing assets in connection with the review of mine operating and development plans. If it is determined that assigned asset lives do not reï¬,ect the expected remaining period of beneï¬t, any change could affect prospective depreciation rates. As discussed below and in Note 1, we... -
Page 37
... Scott Company, L.P.: Oil and Natural Gas (MMBOE) Acquisitions of PXP and MMR Extensions and discoveries Revisions of previous estimates Sales of reserves in-place Production Estimated proved reserves at December 31, 2013 472 24 7 (1) (38) 464 Refer to Note 21 for further information regarding... -
Page 38
... to changes over time based on our drilling plans and Impairment of Goodwill. We account for business combinations using the acquisition method of accounting, which requires us to allocate the purchase price to the assets acquired and liabilities assumed based on their estimated fair values on... -
Page 39
... reclamation and closure costs. At least annually, we review our ARO estimates for changes in the projected timing of certain reclamation and closure/restoration costs, changes in cost estimates and additional AROs incurred during the period. At December 31, 2013, AROs recorded in our consolidated... -
Page 40
... 31, 2013 2012 2011 Revenues North America copper mines South America mining Indonesia mining Africa mining Molybdenum mines Rod & Refining Atlantic Copper Smelting & Refining U.S. oil & gas operations Other mining, corporate, other & eliminations Total FCX revenues Operating income (loss... -
Page 41
...-product credits) for all copper mines, excluding net noncash and other costs. For reconciliations of the per pound unit costs by operating division to production and delivery costs applicable to sales reported in our consolidated financial statements, refer to "Product Revenues and Production Costs... -
Page 42
...) (275) (309) Purchased Copper From time to time, we purchase copper cathode for processing by our Rod & Reï¬ning segment when production from our North America copper mines does not meet customer demand. Atlantic Copper Revenues - The decrease in Atlantic Copper's revenues in 2013, compared with... -
Page 43
... the acquisition of PXP, we assumed derivative contracts for 2013, 2014 and 2015 that consisted of crude oil options, and crude oil and natural gas swaps. These crude oil and natural gas derivative contracts are not designated as hedging instruments; accordingly, they are recorded at fair value with... -
Page 44
... taxes and equity in affiliated companies' net earnings. b. In 2012, Cerro Verde signed a new 15-year mining stability agreement with the Peruvian government, which became effective January 1, 2014. In connection with the new mining stability agreement, Cerro Verde's income tax rate increased from... -
Page 45
... North America Copper Mines We operate seven open-pit copper mines in North America - Morenci, Bagdad, Safford, Sierrita and Miami in Arizona, and Chino and Tyrone in New Mexico. All of the North America mining operations are wholly owned, except for Morenci. We record our 85 percent joint venture... -
Page 46
... information about the cash-generating capacity of our mining operations expressed on a basis relating to the primary metal product for our 2013 By-Product Method Co-Product Method Copper Molybdenuma By-Product Method 2012 Co-Product Method Copper Molybdenuma Revenues, excluding adjustments Site... -
Page 47
... support a major mill project. Future investments will be dependent on technical studies, economic factors and global market conditions. South America Mining We operate four copper mines in South America - Cerro Verde in Peru, and El Abra, Candelaria and Ojos del Salado in Chile. We own a 53... -
Page 48
...lower than 2013 volumes, primarily reï¬,ecting lower ore grades at Candelaria and Cerro Verde. Refer to "Outlook" for projected gold and molybdenum sales volumes. 2012 compared with 2011. Copper sales volumes from our South America mining operations totaled 1.25 billion pounds in 2012, compared with... -
Page 49
... $16 million ($0.01 per pound) at Candelaria in 2012 and $50 million ($0.04 per pound) at Cerro Verde and El Abra in 2011. Unit net cash costs (net of by-product credits) for our South America mining operations increased to $1.50 per pound of copper in 2012, compared with $1.20 per pound in 2011... -
Page 50
... 31, 2013 ($0.5 billion during 2013). Operating Data. Following is summary operating data for our Indonesia mining operations for the years ended December 31. 2013 2012 2011 Operating Data, Net of Joint Venture Interest Copper (millions of recoverable pounds) 915 Production Sales 885 Average... -
Page 51
... to provide investors with information about the cash-generating capacity of our mining operations By-Product Method Co-Product Method Copper Gold Revenues, excluding adjustments Site production and delivery, before net noncash and other costs shown below Gold and silver credits Treatment charges... -
Page 52
... mining and milling rates resulting from the expansion project completed in early 2013, and higher ore grades. Consolidated sales volumes from our Africa mining operations are expected to approximate 445 million pounds of copper and 30 million pounds of cobalt in 2014. 50 | FREEPORT-McMoRan -
Page 53
MANAGEMENT'S DISCUSSION AND ANALYSIS 2012 compared with 2011. Copper sales volumes from our Africa mining operations increased to 336 million pounds of copper in 2012, compared with 283 million pounds of copper in 2011, primarily reï¬,ecting higher mining and milling rates principally related to ... -
Page 54
...nancial statements. a. Includes molybdenum production from the Climax mine since the start of commercial operations in May 2012. b. The year 2013 reflects operating data for the Henderson and Climax mines; 2012 and 2011 reflect the operating data of only the Henderson mine. 52 | FREEPORT-McMoRan -
Page 55
... of our oil and gas revenues were from oil and NGLs. a. The year 2013 reflects operating data for the Henderson and Climax mines; 2012 and 2011 reflect the results of only the Henderson mine. b. Revenues reflect sales of the molybdenum mines' production to our molybdenum sales company at market... -
Page 56
... position in an oil- and NGL-rich section of the Eagle Ford shale play in South Texas. Production from the ï¬eld has grown signiï¬cantly in recent years and averaged 46 MBOE per day during the seven-month period following the acquisition date of our oil and gas operations in 2013. As part of... -
Page 57
... to review our portfolio of assets for opportunities to accelerate our deleveraging plans through potential asset sales, joint venture transactions or further adjustments to capital spending plans. Realized revenues for our oil and gas operations averaged $76.87 per BOE and cash production costs... -
Page 58
... projects at mining operations in 2013 were primarily associated with the expansion projects at Morenci and Cerro Verde and our underground development activities at Grasberg, partly offset by decreased spending for the expansion at Tenke, which was completed in early 2013, and at the Climax mine... -
Page 59
...ï¬rst-quarter 2013, we paid $348 million (net of $34 million of cash acquired) to acquire a cobalt chemical reï¬nery in Kokkola, Finland, and the related sales and marketing business. The acquisition was funded 70 percent by us and 30 percent by Lundin Mining Corporation, our joint venture partner... -
Page 60
... with legal proceedings and other matters. DISCLOSURES ABOUT MARKET RISKS Commodity Price Risk Metals. Our consolidated revenues from our mining operations include the sale of copper concentrates, copper cathodes, copper rod, gold, molybdenum and other metals by our North and South America mines... -
Page 61
... for a substantial portion of its oil and gas production through 2015. In connection with the acquisition of PXP, we assumed derivative contracts for 2013, 2014 and 2015 that consisted of crude oil options, and crude oil and natural gas swaps. These crude oil and natural gas 2013 ANNUAL REPORT | 59 -
Page 62
... our scheduled maturities of principal for our outstanding debt (excluding fair value adjustments) and the related fair values at December 31, 2013 (in millions, except percentages): 2014 Fixed-rate debt Average interest rate Variable-rate debt Average interest rate $ 5 6.8% $ 307 1.6% 2015 $ 502... -
Page 63
... metal revenues at copper mines are reï¬,ected as credits against site production and delivery costs in the by-product method. The following schedules for our mining operations are presentations under both the by-product and co-product methods together with reconciliations to amounts reported in... -
Page 64
... charges Net noncash and other costs Revenue adjustments, primarily for pricing on prior period open sales Eliminations and other North America copper mines Other mining & eliminationsd Total mining U.S. oil & gas operations Corporate, other & eliminations As reported in FCX's consolidated financial... -
Page 65
... the North America copper mines to our molybdenum sales company at market-based pricing. b. Includes gold and silver product revenues and production costs. c. Represents the combined total for all other mining operations and the related eliminations, as presented in Note 16. 2013 ANNUAL REPORT | 63 -
Page 66
...of the North America copper mines to our molybdenum sales company at market-based pricing. b. Includes gold and silver product revenues and production costs. c. Represents the combined total for all other mining operations and the related eliminations, as presented in Note 16. 64 | FREEPORT-McMoRan -
Page 67
... our molybdenum sales company at market-based pricing. b. Includes charges totaling $36 million ($0.03 per pound) associated with labor agreement costs at Cerro Verde. c. Represents the combined total for all other mining operations and the related eliminations, as presented in Note 16. 2013 ANNUAL... -
Page 68
... Cerro Verde to our molybdenum sales company at market-based pricing. b. Includes $16 million ($0.01 per pound) associated with labor agreement costs at Candelaria. c. Represents the combined total for all other mining operations and the related eliminations, as presented in Note 16. 66 | FREEPORT... -
Page 69
... sales company at market-based pricing. b. Includes $50 million ($0.04 per pound) for bonuses paid at Cerro Verde and El Abra pursuant to new labor agreements. c. Represents the combined total for all other mining operations and the related eliminations, as presented in Note 16. 2013 ANNUAL REPORT... -
Page 70
... Net noncash and other costs Revenue adjustments, primarily for pricing on prior period open sales PT Smelting intercompany loss Indonesia mining Other mining & eliminationsb Total mining U.S. oil & gas operations Corporate, other & eliminations As reported in FCX's consolidated financial statements... -
Page 71
... Net noncash and other costs Revenue adjustments, primarily for pricing on prior period open sales PT Smelting intercompany loss Indonesia mining Other mining & eliminationsb Total mining U.S. oil & gas operations Corporate, other & eliminations As reported in FCX's consolidated financial statements... -
Page 72
... noncash and other costs Revenue adjustments, primarily for pricing on prior period open sales PT Smelting intercompany profit Indonesia mining Other mining & eliminationsc Total mining U.S. oil & gas operations Corporate, other & eliminations As reported in FCX's consolidated financial statements... -
Page 73
... sales Africa mining Other mining & eliminationsc Total mining U.S. oil & gas operations Corporate, other & eliminations As reported in FCX's consolidated financial statements a. Includes point-of-sale transportation costs as negotiated in customer contracts. b. Net of cobalt downstream processing... -
Page 74
... sales Africa mining Other mining & eliminationsc Total mining U.S. oil & gas operations Corporate, other & eliminations As reported in FCX's consolidated financial statements a. Includes point-of-sale transportation costs as negotiated in customer contracts. b. Net of cobalt downstream processing... -
Page 75
... sales Africa mining Other mining & eliminationsc Total mining U.S. oil & gas operations Corporate, other & eliminations As reported in FCX's consolidated financial statements a. Includes point-of-sale transportation costs as negotiated in customer contracts. b. Net of cobalt downstream processing... -
Page 76
... other mining operations and the related eliminations, as presented in Note 16. Also includes amounts associated with FCX's molybdenum sales company, which includes sales of molybdenum produced by the molybdenum mines and by certain of the North and South America copper mines. 74 | FREEPORT-McMoRan -
Page 77
... Includes $85 million ($2.23 per BOE) of noncash losses realized on 2013 derivative contracts resulting from amounts recorded as part of acquisition accounting. b. Represents the combined total for all mining operations and the related eliminations, as presented in Note 16. 2013 ANNUAL REPORT | 75 -
Page 78
... costs per BOE, operating cash ï¬,ows, capital expenditures, exploration efforts and results, development and production activities and costs, liquidity, tax rates, the impact of copper, gold, molybdenum, cobalt, crude oil and natural gas price changes, the impact of derivative positions, the impact... -
Page 79
... REPORTING Freeport-McMoRan Copper & Gold Inc.'s (the Company's) management is responsible for establishing and maintaining adequate internal control over ï¬nancial reporting. Internal control over ï¬nancial reporting is deï¬ned in Rule 13a-15(f) or 15d-15(f) under the Securities Exchange... -
Page 80
... with the standards of the Public Company Accounting Oversight Board (United States), the consolidated balance sheets of Freeport-McMoRan Copper & Gold Inc. as of December 31, 2013 and 2012 and the related consolidated statements of income, comprehensive income, equity and cash ï¬,ows for each of... -
Page 81
REPORT OF INDEPENDENT REGISTERED PUBLIC ACCOUNTING FIRM TO THE BOARD OF DIRECTORS AND STOCKHOLDERS OF FREEPORT- M C M OR AN COPPER & GOLD INC. We have audited the accompanying consolidated balance sheets of Freeport-McMoRan Copper & Gold Inc. as of December 31, 2013 and 2012, and the related ... -
Page 82
... millions, except per share amounts) 2013 2012 2011 Revenues Cost of sales: Production and delivery Depreciation, depletion and amortization Total cost of sales Selling, general and administrative expenses Mining exploration and research expenses Environmental obligations and shutdown costs Gain... -
Page 83
... North America copper mines South America Indonesia Africa Molybdenum mines U.S. oil and gas operations Other Acquisition of Plains Exploration & Production Company, net of cash acquired Acquisition of MMR, net of cash acquired Acquisition of cobalt chemical business, net of cash acquired Restricted... -
Page 84
...31, 2013 Not subject to amortization Long-term mill and leach stockpiles Goodwill Other assets Total assets LIABILITIES AND EQUITY Current liabilities: Accounts payable and accrued liabilities Dividends payable Current portion of debt Current portion of environmental and asset retirement obligations... -
Page 85
... Balance at December 31, 2012 Common stock issued to acquire Plains Exploration & Production Company Exchange of employee stock-based awards in connection with acquisitions Exercised and issued stock-based awards Stock-based compensation Reserve on tax benefit for stock-based awards Tender of shares... -
Page 86
...), Atlantic Copper, S.L.U. (Atlantic Copper) and FCX Oil & Gas Inc. (FM O&G). FCX acquired Plains Exploration & Production Company (PXP) and McMoRan Exploration Co. (MMR), collectively known as FM O&G, on May 31, 2013, and June 3, 2013, respectively. FCX's results of operations include PXP's results... -
Page 87
... and reï¬ning process plus in-process conversion costs. Finished Goods. Finished goods for mining operations represent salable products (e.g., copper and molybdenum concentrates, copper anodes, copper cathodes, copper rod, copper wire, molybdenum oxide, high-purity molybdenum chemicals and other... -
Page 88
...with production, operations, marketing and general corporate activities are charged to expense as incurred. Capitalized costs, along with estimated future costs to develop proved reserves and asset retirement costs that are not already included in oil and gas properties, net of related salvage value... -
Page 89
... of long-lived assets and measure the fair value of FCX's mining operations are derived from current business plans, which are developed using near-term price forecasts reï¬,ective of the current price environment and management's projections for long-term average metal prices. Estimates of... -
Page 90
... associated with mine reclamation and closure activities. These activities, which are site speciï¬c, generally include costs for earthwork, revegetation, water treatment and demolition (refer to Note 12 for further discussion). For oil and gas properties, the fair value of the legal obligation is... -
Page 91
... molybdenum sales generally have pricing that is either based on the current month published prices or a ï¬xed price. PT-FI concentrate sales and TFM metal sales are subject to certain royalties, which are recorded as a reduction to revenues (refer to Note 13 for further discussion). Oil and gas... -
Page 92
... 2. ACQUISITIONS Oil and Gas. FCX acquired PXP on May 31, 2013, and MMR on June 3, 2013. These acquisitions added a portfolio of oil and gas assets to FCX's global mining business, creating a U.S.-based natural resources company. The portfolio of oil and gas assets includes oil production facilities... -
Page 93
...crude oil and natural gas forward prices. The excess of the total consideration over the estimated fair value of the amounts initially assigned to the identiï¬able assets acquired, liabilities assumed and redeemable noncontrolling interest has been recorded as goodwill. Goodwill 2013 ANNUAL REPORT... -
Page 94
... the properties acquired by PXP in 2012 from BP Exploration & Production Inc., BP America Production Company and Shell Offshore Inc. The Preferred Stock represents a 20 percent equity interest in Plains Offshore and is entitled to a dividend of 8 percent per annum, payable quarterly, of which... -
Page 95
...and earnings per share. Changes in the redemption value are accreted over the period from the date FCX acquired PXP to the earliest redemption date. Redeemable Noncontrolling Interest - MMR. The enhanced "make-whole" conversion rates triggered by FCX's acquisition of MMR expired on July 9, 2013, for... -
Page 96
... mines in North America, South America and the Tenke minerals district in the DRC. At December 31, 2013, FMC's operating mines in North America were Morenci, Bagdad, Safford, Sierrita and Miami located in Arizona; Tyrone and Chino located in New Mexico; and Henderson and Climax located in Colorado... -
Page 97
..., plant, equipment and mining development costs follow: December 31, 2013 2012 a. Included $210 million (time deposit that secures a bank guarantee) associated with the Cerro Verde royalty dispute and $158 million for AROs related to properties in New Mexico at December 31, 2013, and $161 million... -
Page 98
...a new senior unsecured $3.0 billion revolving credit facility, which replaced FCX's existing revolving credit facility (scheduled to mature on March 30, 2016) upon completion of the acquisition of PXP on May 31, 2013. In connection with the PXP acquisition, Freeport-McMoRan Oil & Gas LLC (FM O&G LLC... -
Page 99
... of the proceeds of an equity issuance by FM O&G LLC. Upon completion of the acquisition of PXP, FCX guaranteed these senior notes resulting in an investment grade rating for these senior notes. Debt Instrument Date Early Extinguishment of Debt. In 2013, FCX completed the following transactions... -
Page 100
...; long-term, high-credit quality corporate bonds; high-yield and emerging markets ï¬xed income securities; and ï¬xed income debt securities) and 10 percent alternative investments (private real estate, real estate investment trusts and private equity). The expected rate of return on plan assets is... -
Page 101
... developed based on pricing and yield information for high-quality corporate bonds. Changes in the discount rate are reï¬,ected in FCX's beneï¬t obligation and, therefore, in future pension costs. Other FCX Plans. In February 2004, FCX established an unfunded Supplemental Executive Retirement Plan... -
Page 102
... Value at December 31, 2012 Total Level 1 Level 2 Level 3 Commingled/collective funds: Global equity U.S. real estate securities U.S. small-cap equity Real estate property Short-term investments Open-ended mutual funds: Government bonds Emerging markets equity Corporate bonds Mutual funds: Foreign... -
Page 103
... assets measured at fair value associated with the PT-FI plan. There have been no changes to the techniques used to measure fair value. Common stocks, government bonds and mutual funds are valued at the closing price reported on the active market on which the individual securities are traded and, as... -
Page 104
... position; copper, molybdenum, gold, crude oil and natural gas prices; the price of FCX's common stock; and general economic and market conditions. FCX's Board of Directors (the Board) authorized an increase in the cash dividend on FCX's common stock in February 2012 to the current annual rate of... -
Page 105
...STATEMENTS On December 20, 2013, the Board declared a regular quarterly dividend of $0.3125 per share, which was paid on February 3, 2014, to common shareholders of record at the close of business on January 15, 2014. The declaration of dividends is at the discretion of the Board and will depend on... -
Page 106
... or SAR. Information related to stock options during the years ended December 31 follows: 2013 2012 2011 Weighted-average assumptions used to value stock option awards: Expected volatility Expected life of options (in years) Expected dividend rate Risk-free interest rate Weighted-average grant... -
Page 107
... income taxes and equity in afï¬liated companies' net earnings for the years ended December 31 4.1 $ 161 consist of the following: 2013 2012 2011 The total fair value of stock-settled RSUs granted during the year ended December 31, 2013, was $125 million, including $38 million for PXP awards that... -
Page 108
... related to environmental liabilities. In 2012, Sociedad Minera Cerro Verde S.A.A. (Cerro Verde) signed a new 15-year mining stability agreement with the Peruvian government, which became effective January 1, 2014. In connection with the new mining stability agreement, Cerro Verde's income tax rate... -
Page 109
...FCX's El Abra and Candelaria mines were stabilized through 2017 at a rate of 4 percent. However, under the legislation, FCX opted to transfer from its stabilized rate to the sliding scale of 4 to 9 percent for the years 2011 and 2012 and returned to its 4 percent rate for the years 2013 through 2017... -
Page 110
...natural resources (NRD). As of December 31, 2013, FCX had more than 100 active remediation projects, including NRD claims, in 28 U.S. states. A summary of changes in environmental obligations for the years ended December 31 follows: 2013 2012 2011 U.S. Federal Indonesia Peru Chile Africa 2007-2012... -
Page 111
... uranium mining sites in the western U.S. The recorded environmental obligations for these sites totaled $1.0 billion at December 31, 2013. A discussion of these sites follows. Pinal Creek. The Pinal Creek site was listed under the Arizona Department of Environmental Quality's (ADEQ) Water Quality... -
Page 112
..., 2013. These rules identify closure requirements for copper mine facilities. The rules were adopted after an extensive stakeholder process in which FCX participated and were jointly supported by FCX and NMED. Although the rules are being challenged in the New Mexico courts by certain environmental... -
Page 113
... fund would be funded by operational cash ï¬,ow or other sources. In December 2009, PT-FI submitted its revised mine closure plan to the Department of Energy and Mineral Resources for review and has addressed comments received during the course of this review process. In December 2010, the President... -
Page 114
... Money Purchase Pension Plan Trust v. Moffett et al., No. 8389-VCN. A motion to consolidate that action with In Re Freeport-McMoRan Copper & Gold Inc. Derivative Litigation is pending. On January 17, 2013, the Arizona Superior Court consolidated two of the Arizona actions into In Re Freeport-McMoRan... -
Page 115
... 31, 2013. Letters of Credit, Bank Guarantees and Surety Bonds. Letters of credit and bank guarantees totaled $326 million at December 31, 2013, primarily for the Cerro Verde royalty dispute (bank guarantee secured by a time deposit - refer to discussion above), environmental and asset retirement... -
Page 116
... agreed to pay an aggregate of $63 million, including PT-FI's joint venture partner's share. As a result of the settlement, FCX recorded a gain of $59 million in 2012. Mining Contracts - Indonesia. FCX is entitled to mine in Indonesia under the Contract of Work between PT-FI and the Government of... -
Page 117
... 2011). The current ARMC will remain in effect for as long as the Tenke concession is exploitable. The royalty rate payable by TFM under the ARMC is two percent of net revenue. These mining royalties totaled $29 million in 2013, $25 million in 2012 and $24 million in 2011. 2013 ANNUAL REPORT | 115 -
Page 118
... oil and natural gas commodity prices. Derivative ï¬nancial instruments used by FCX to manage its risks do not contain credit risk-related contingent provisions. As of December 31, 2013 and 2012, FCX had no price protection contracts relating to its mine production. A discussion of FCX's derivative... -
Page 119
... a result of the acquisition of PXP, FCX assumed PXP's 2013, 2014 and 2015 derivative instruments that consisted of crude oil options, and crude oil and natural gas swaps. The crude oil and natural gas derivatives are not designated as hedging instruments and are recorded at fair value with the mark... -
Page 120
... securities, legally restricted funds, accounts payable and accrued liabilities, dividends payable and long-term debt. The carrying value for cash and cash equivalents (which included time deposits of a. FCX had paid $1 million to brokers at December 31, 2013, and $7 million at December 31, 2012... -
Page 121
..., 2012), accounts receivable, accounts payable and accrued liabilities, and dividends payable approximates fair value because of their short-term nature and generally negligible credit losses (refer to Note 15 for the fair values of investment securities, legally restricted funds and long-term debt... -
Page 122
...616 a. Recorded at fair value. b. Current portion included in other current assets and long-term portion included in other assets. c. Legally restricted funds excluded $210 million of time deposits (which approximated fair value) at December 31, 2013, associated with the Cerro Verde royalty dispute... -
Page 123
...A summary of the changes in the fair value of FCX's Level 3 instruments follows: Crude Oil Options Plains Offshore Warrants Fair value at December 31, 2012 Derivative ï¬nancial instruments assumed in the PXP acquisition Net realized losses Net unrealized (losses) gains included in earnings related... -
Page 124
... customer, who pays FCX for processing its material into the speciï¬ed products. North America Copper Mines. FCX has seven operating copper mines in North America - Morenci, Bagdad, Safford, Sierrita and Miami in Arizona, and Tyrone and Chino in New Mexico. The North America copper mines include... -
Page 125
...31, 2013 2012 2011 U.S. Oil & Gas Operations. FCX's U.S. oil and gas operations include oil production facilities and growth potential in the Deepwater GOM, oil production from the onshore Eagle Ford shale play in Texas, oil production facilities onshore and offshore California, onshore natural gas... -
Page 126
... Copper Other Molybdenum Rod & Smelting Mining & Tenke Mines Refining & Refining Eliminations U.S. Corporate, Oil & Gas Other & FCX Operations Eliminations Total Morenci Other Mines Total Cerro Verde Candelaria Other Mines Total Grasberg Total Mining Year Ended December 31, 2013 Revenues... -
Page 127
...Mining Operations North America Copper Mines South America Indonesia Africa Atlantic Copper Other Molybdenum Rod & Smelting Mining & Tenke Mines Refining & Refining Eliminations U.S. Corporate, Oil & Gas Other & FCX Operations Eliminations Total Morenci Other Mines Total Cerro Verde Candelaria... -
Page 128
... 31, 2013 FCX Issuer FM O&G LLC Guarantor Non-guarantor Subsidiaries Eliminations Consolidated FCX ASSETS Current assets: Cash and cash equivalents Accounts receivable Inventories Other current assets Total current assets Property, plant, equipment and mining development costs, net Oil and gas... -
Page 129
... crude oil and natural gas derivative contracts Gain on investment in MMR Equity in earnings of consolidated subsidiaries Other, net (Increases) decreases in working capital and changes in other tax payments, excluding amounts from the acquisitions Net cash (used in) provided by operating activities... -
Page 130
... and related costs principally associated with the acquisitions of PXP and MMR. c. Included charges in the fourth quarter and for the year of (i) $76 million ($49 million to net income attributable to FCX common stockholders or $0.05 per share) associated with updated mine plans at Morenci that... -
Page 131
... and legally extracted or produced at the time of the reserve determination. North America South America Indonesia Africa Consolidated b Net equity interest c Recoverable Proven and Probable Mineral Reserves Estimated at December 31, 2013 Coppera (billion pounds) Gold (million ounces) Molybdenum... -
Page 132
... and Probable Reserves b Gold (million ounces) Molybdenum (billion pounds) North America Developed and producing: Morenci Bagdad Safford Sierrita Miami Chino Tyrone Henderson Climax Undeveloped: Cobre South America Developed and producing: Cerro Verde El Abra Candelaria Ojos del Salado Indonesia... -
Page 133
... 70 percent of the acreage in the Eagle Ford shale play in Texas is currently held by production or held by operations, and future plans include drilling or otherwise extending leases on the remaining acreage. a. Included $12.2 billion from the acquisitions of PXP and MMR. b. Included $11.1 billion... -
Page 134
... Haynesville shale play. From June 1, 2013, to December 31, 2013, FCX sold reserves in-place totaling 1 MMBOE related to its Panhandle properties. Standardized Measure. The Standardized Measure (discounted at 10 percent) from production of proved oil and natural gas reserves has been developed as... -
Page 135
... Measure related to proved oil and natural gas reserves as of December 31, 2013, follows: Future cash inï¬,ows Future production expense Future development costsa Future income tax expense Future net cash ï¬,ows Discounted at 10% per year Standardized Measure a. Included estimated asset retirement... -
Page 136
..., which closely mirror the benchmarks of other large companies in the materials and energy sectors. This comparison assumes $100 invested on December 31, 2008, in (a) Freeport-McMoRan Copper & Gold Inc. common stock, (b) the S&P 500 Stock Index, (c) the S&P 500 Materials Index and (d) the S&P 500... -
Page 137
... its annual meeting, upon written request. The Investor Relations Department can be contacted as follows: Freeport-McMoRan Investor Relations Department 333 North Central Avenue Phoenix, Arizona 85004 Telephone (602) 366-8400 www.fcx.com COMMON STOCK DIVIDENDS In February 2012, the Board authorized... -
Page 138
333 North Central Avenue Phoenix, Arizona 85004 602.366.8100 www.fcx.com