Food Lion 2008 Annual Report Download - page 88
Download and view the complete annual report
Please find page 88 of the 2008 Food Lion annual report below. You can navigate through the pages in the report by either clicking on the pages listed below, or by using the keyword search tool below to find specific information within the annual report.-
 1
1 -
2
-
3
-
4
-
5
-
6
-
7
-
8
-
9
-
10
-
11
-
12
-
13
-
14
-
15
-
16
-
17
-
18
-
19
-
20
-
21
-
22
-
23
-
24
-
25
-
26
-
27
-
28
-
29
-
30
-
31
-
32
-
33
-
34
-
35
-
36
-
37
-
38
-
39
-
40
-
41
-
42
-
43
-
44
-
45
-
46
-
47
-
48
-
49
-
50
-
51
-
52
-
53
-
54
-
55
-
56
-
57
-
58
-
59
-
60
-
61
-
62
-
63
-
64
-
65
-
66
-
67
-
68
-
69
-
70
-
71
-
72
-
73
-
74
-
75
-
76
-
77
-
 78
78 -
 79
79 -
 80
80 -
 81
81 -
 82
82 -
 83
83 -
 84
84 -
 85
85 -
 86
86 -
 87
87 -
 88
88 -
 89
89 -
 90
90 -
 91
91 -
 92
92 -
 93
93 -
 94
94 -
 95
95 -
 96
96 -
 97
97 -
 98
98 -
99
-
100
-
101
-
102
-
103
-
104
-
105
-
106
-
107
-
108
-
109
-
110
-
111
-
112
-
113
-
114
-
115
-
116
-
117
-
118
-
119
-
120
-
121
-
122
-
123
-
124
-
125
-
126
-
127
-
128
-
129
-
130
-
131
-
132
-
133
-
134
-
135
 |
 |

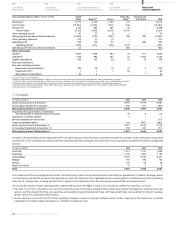
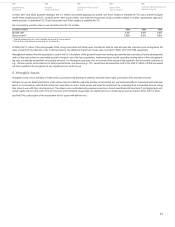
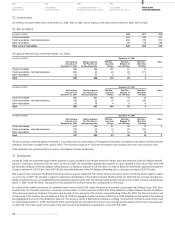
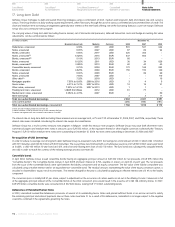
(in millions of EUR) Trade Developed Purchased Favorable Other Total
Names Software Software Lease Rights
Cost at January 1, 2008 354 86 120 224 46 830
Additions - 36 22 - 5 63
Sales and disposals - - (3) (22) - (25)
Acquisitions through business combinations - - - 4 1 5
Transfers to/from other accounts - (3) 7 - (3) 1
Currency translation effect 20 4 6 11 3 44
Cost at December 31, 2008 374 123 152 217 52 918
Accumulated amortization at January 1, 2008 - (42) (57) (124) (18) (241)
Accumulated impairment at January 1, 2008 (32) - - (5) - (37)
Amortization expense - (12) (22) (15) (3) (52)
Sales and disposals - - 3 22 - 25
Currency translation effect (2) (2) (4) (7) (1) (16)
Accumulated amortization at December 31, 2008 - (56) (80) (124) (22) (282)
Accumulated impairment at December 31, 2008 (34) - - (5) - (39)
Net carrying amount at December 31, 2008 340 67 72 88 30 597
Cost at January 1, 2007 396 75 96 272 45 884
Additions - 20 30 1 8 59
Sales and disposals - - - (21) (2) (23)
Transfers to/from other accounts - (2) 3 (1) - -
Currency translation effect (42) (7) (9) (27) (5) (90)
Cost at December 31, 2007 354 86 120 224 46 830
Accumulated amortization at January 1, 2007 - (35) (43) (141) (19) (238)
Accumulated impairment at January 1, 2007 (36) - - (5) - (41)
Amortization expense - (10) (19) (20) (3) (52)
Sales and disposals - - - 21 2 23
Transfers to/from other accounts - - - 1 - 1
Currency translation effect 4 3 5 15 2 29
Accumulated amortization at December 31, 2007 - (42) (57) (124) (18) (241)
Accumulated impairment at December 31, 2007 (32) - - (5) - (37)
Net carrying amount at December 31, 2007 322 44 63 95 28 552
Cost at January 1, 2006 442 57 82 322 45 948
Additions - 21 26 1 4 52
Sales and disposals - - (1) (16) - (17)
Transfers to/from other accounts - 2 (1) (2) 1 -
Currency translation effect (46) (5) (8) (33) (5) (97)
Amount classified as held for sale - - (2) - - (2)
Cost at December 31, 2006 396 75 96 272 45 884
Accumulated amortization at January 1, 2006 - (29) (33) (149) (17) (228)
Accumulated impairment at January 1, 2006 (40) - - (5) - (45)
Amortization expense - (9) (16) (24) (4) (53)
Sales and disposals - - - 17 - 17
Transfers to/from other accounts - - - (1) - (1)
Currency translation effect 4 3 4 16 2 29
Amount classified as held for sale - - 2 - - 2
Accumulated amortization at December 31, 2006 - (35) (43) (141) (19) (238)
Accumulated impairment at December 31, 2006 (36) - - (5) - (41)
Net carrying amount at December 31, 2006 360 40 53 126 26 605
Trade name assets are allocated as follows:
(in millions of EUR) December 31,
2008 2007 2006
Food Lion 185 175 196
Hannaford 155 147 164
United States 340 322 360
Amortization expenses are charged to selling, general and administrative expenses.
Consolidated
Balance Sheets
Consolidated
Income Statements
Consolidated Statements of
Recognized Income and Expense
Consolidated
Statements of Cash Flows
84 - Delhaize Group - Annual Report 2008
Notes to the
Financial Statements