Exxon 2014 Annual Report Download - page 6
Download and view the complete annual report
Please find page 6 of the 2014 Exxon annual report below. You can navigate through the pages in the report by either clicking on the pages listed below, or by using the keyword search tool below to find specific information within the annual report.-
 1
1 -
 2
2 -
 3
3 -
 4
4 -
 5
5 -
 6
6 -
 7
7 -
 8
8 -
 9
9 -
 10
10 -
 11
11 -
 12
12 -
 13
13 -
 14
14 -
 15
15 -
 16
16 -
 17
17 -
18
-
19
-
20
-
21
-
22
-
23
-
24
-
25
-
26
-
27
-
28
-
29
-
30
-
31
-
32
-
33
-
34
-
35
-
36
-
37
-
38
-
39
-
40
-
41
-
42
-
43
-
44
-
45
-
46
-
47
-
48
-
49
-
50
-
51
-
52
 |
 |

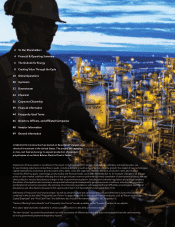
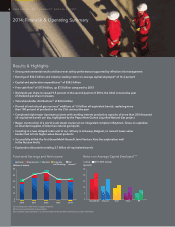
Results & Highlights
• Strong environmental results and best-ever safety performance supported by effective risk management
• Earnings of $32.5 billion and industry-leading return on average capital employed
(1)
of 16.2 percent
• Capital and exploration expenditures
(1)
of $38.5 billion
• Free cash flow
(1)
of $17.9 billion, up $7. 3 billion compared to 2013
• Dividends per share increased 9.5 percent in the second quarter of 2014, the 32nd consecutive year
of dividend-per-share increases
• Total shareholder distributions
(1)
of $23.6 billion
• Proved oil and natural gas reserves
(1)
additions of 1.5 billion oil-equivalent barrels, replacing more
than 100 percent of production for the 21st consecutive year
• Completed eight major Upstream projects with working interest production capacity of more than 250 thousand
oil-equivalent barrels per day, highlighted by the Papua New Guinea Liquefied Natural Gas project
• Began construction of a world-scale steam cracker at our integrated complex in Baytown, Texas, to capitalize
on abundant supplies of American natural gas liquids
• Investing in a new delayed coker unit at our refinery in Antwerp, Belgium, to convert lower-value
bunker fuel oil into higher-value diesel products
• Successfully drilled the first ExxonMobil-Rosneft Joint Venture Kara Sea exploration well
in the Russian Arctic
• Exploration discoveries totaling 2.7 billion oil-equivalent barrels
(1) See Frequently Used Terms on pages 44 and 45.
(2) Net income attributable to ExxonMobil.
(3) Competitor data estimated on a consistent basis with ExxonMobil and based on public information.
Eric Whetstone • Whetstone Design
EDITOR
Nick Berthiaux • Investor Relations
Exxon Mobil Corporation, Irving, TX
Carol Zuber-Mallison • ZM Graphics, Inc.
studio/cell: 214-906-4162 • fax: 817-924-7784
ATTENTION: OWNER VERSION
APPROVED BY
Feb. 13, 2015
FILE INFO
LAST FILE CHANGE MADE BY
C S04A 14XOM-
FuncEarnings.ai
IN F&O ON PAGE
IN SAR ON PAGE
Includes link file
50
40
30
20
10
0
–3 2010 2011 201420132012
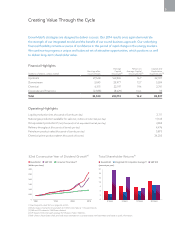
Functional Earnings and Net Income
(billions of dollars)
Upstream Downstream Chemical Corporate
and Financing
Net
Income(2)
25
20
15
10
5
0
Return on Average Capital Employed(1)(3)
ExxonMobil ShellChevron BPTotal
(percent)
2014 2010–2014 average
Eric Whetstone • Whetstone Design
EDITOR
Nick Berthiaux • Investor Relations
Exxon Mobil Corporation, Irving, TX
Carol Zuber-Mallison • ZM Graphics, Inc.
studio/cell: 214-906-4162 • fax: 817-924-7784
ATTENTION: OWNER VERSION
APPROVED BY
Feb. 19, 2015
FILE INFO
LAST FILE CHANGE MADE BY
C S04B 14XOM-
ROCE.ai
IN F&O ON PAGE
IN SAR ON PAGE
Includes link file
2014: Financial & Operating Summary
4EXXONMOBIL 2014 SUMMARY ANNUAL REPORT