Exxon 2011 Annual Report Download - page 6
Download and view the complete annual report
Please find page 6 of the 2011 Exxon annual report below. You can navigate through the pages in the report by either clicking on the pages listed below, or by using the keyword search tool below to find specific information within the annual report.-
 1
1 -
 2
2 -
 3
3 -
 4
4 -
 5
5 -
 6
6 -
 7
7 -
 8
8 -
 9
9 -
 10
10 -
 11
11 -
 12
12 -
 13
13 -
 14
14 -
 15
15 -
 16
16 -
 17
17 -
18
-
19
-
20
-
21
-
22
-
23
-
24
-
25
-
26
-
27
-
28
-
29
-
30
-
31
-
32
-
33
-
34
-
35
-
36
-
37
-
38
-
39
-
40
-
41
-
42
-
43
-
44
-
45
-
46
-
47
-
48
-
49
-
50
-
51
-
52
 |
 |

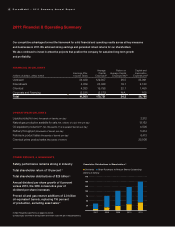
2011: Financial & Operating Summary
Our competitive advantages formed the framework for solid financial and operating results across all key measures
and businesses in 2011. We achieved strong earnings and generated robust returns for our shareholders.
We also continued to invest in attractive projects that position the company for sustained long-term growth
and profitability.
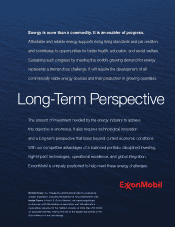
(1) See Frequently Used Terms on pages 44 and 45.
(2) Natural gas converted to oil-equivalent at 6 million cubic feet per 1 thousand barrels.
FINANCIAL HIGHLIGHTS
(millions of dollars, unless noted)
Earnings After
Income Taxes
Average
Capital
Employed
(1)
Return on
Average Capital
Employed (%)
(1)
Capital and
Exploration
Expenditures
(1)
Upstream
34,439 129,807 26.5 33,091
Downstream
4,459 23,388 19.1 2,120
Chemical
4,383 19,798 22.1 1,450
Corporate and Financing
(2,221) (2,272)N.A. 105
Total 41,060 170,721 24.2 36,766
OPERATING HIGHLIGHTS
Liquids production (net, thousands of barrels per day)
2,312
Natural gas production available for sale (net, millions of cubic feet per day)
13,162
Oil-equivalent production(2) (net, thousands of oil-equivalent barrels per day)
4,506
Refinery throughput (thousands of barrels per day)
5,214
Petroleum product sales (thousands of barrels per day)
6,413
Chemical prime product sales (thousands of tonnes)
25,006
OTHER RESULTS & HIGHLIGHTS
Safety performance remains strong in industry
Total shareholder return of 19 percent (1)
Total shareholder distributions of $29 billion (1)
Annual dividend per share growth of 6 percent
versus 2010, the 29th consecutive year of
dividend per share increases
Proved oil and gas reserve additions of 2.0 billion
oil-equivalent barrels, replacing 116 percent
of production, excluding asset sales(1)
175
150
125
100
75
50
25
Dividends
Cumulative Distributions to Shareholders(1)
(billions of dollars)
Share Purchases to Reduce Shares Outstanding
2007 2008 2009
Eric Whetstone • Whetstone Design
ofce: 214-583-6118 • cell:
Neil Hansen • Investor Relations
Exxon Mobil Corporation, Irving, TX
ofce: 972-444-1135 • cell:972-890-5469
Carol Zuber-Mallison • ZM Graphics, Inc.
studio/cell: 214-906-4162 • fax: 817-924-7784
Usage: Exclusive rights within ExxonMobil
(c) 2012, ZM Graphics, Inc. Image can not be resold
Data list is used to drive the black and
template for the color chart. Bars and
lines are cut and pasted from the black
and white template and are highly
accurate. However, the color chart is
NOT linked to the database and is NOT
“driven” by the data; it is a piece of
artwork buiilt by a human. Therefore, the
editor needs to thoroughly proof the nal
artwork, not JUST the data list.
Feb. 16, 2012
LAST FILE CHANGE MADE BY
S04A 11XOMSAR-
.ai
IN F&O ON PAGE
IN SAR ON PAGE
20112010
Yellow is
custom color mix
to match photo
4ExxonMobil • 2011 Summary Annual ReportExxonMobil • 2011 Summary Annual Report