Exxon 2009 Annual Report Download - page 7
Download and view the complete annual report
Please find page 7 of the 2009 Exxon annual report below. You can navigate through the pages in the report by either clicking on the pages listed below, or by using the keyword search tool below to find specific information within the annual report.-
 1
1 -
 2
2 -
 3
3 -
 4
4 -
 5
5 -
 6
6 -
 7
7 -
 8
8 -
 9
9 -
 10
10 -
 11
11 -
 12
12 -
 13
13 -
 14
14 -
 15
15 -
 16
16 -
 17
17 -
 18
18 -
19
-
20
-
21
-
22
-
23
-
24
-
25
-
26
-
27
-
28
-
29
-
30
-
31
-
32
-
33
-
34
-
35
-
36
-
37
-
38
-
39
-
40
-
41
-
42
-
43
-
44
-
45
-
46
-
47
-
48
-
49
-
50
-
51
-
52
-
53
 |
 |

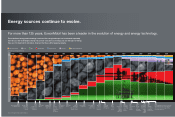
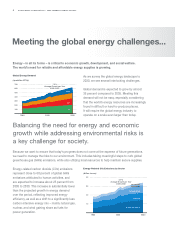
Meeting the global energy challenges...
Energy – in all its forms – is critical to economic growth, development, and social welfare.
The world’s need for reliable and affordable energy supplies is growing.
As we survey the global energy landscape to
2030, we see several interlocking challenges.
Global demand is expected to grow by almost
35 percent compared to 2005. Meeting this
demand will not be easy, especially considering
that the world’s energy resources are increasingly
found in difficult or hard-to-produce places.
It will require the global energy industry to
operate on a scale even larger than today.
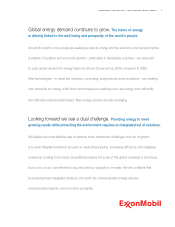
Energy-related carbon dioxide (CO2) emissions
represent close to 60 percent of global GHG
emissions attributed to human activities, and
are expected to increase about 25 percent from
2005 to 2030. This increase is substantially lower
than the projected growth in energy demand
over the period, reflecting improved energy
efficiency, as well as a shift to a significantly less
carbon-intensive energy mix – mainly natural gas,
nuclear, and wind gaining share as fuels for
power generation.
EricWhetstone•WhetstoneDesignLab
office:214-788-6336•cell:
EDITOR
TraceyGunnlaugsson•InvestorRelations
ExxonMobilCorporation,Irving,TX
office:972-444-1151•cell:972-849-6202
fax:972-444-1505
tracey[email protected]
CarolZuber-Mallison•ZMGraphics
studio/cell:214-906-4162•fax:817-924-7784
Usage:ExclusiverightswithinExxonMobil
(c)2010,ZMGraphicsImagecannotberesold
ATTENTION:OWNER
Datalistisusedtodrivetheblackand
whitechart,whichisthenusedasa
templateforthecolorchart.Barsand
linesarecutandpastedfromtheblack
andwhitetemplateandarehighly
accurate.However,thecolorchartis
NOTlinkedtothedatabaseandisNOT
“driven”bythedata;itisapieceof
artworkbuiiltbyahuman.Therefore,the
editorneedstothoroughlyproofthefinal
artwork,notJUSTthedatalist.
VERSION
APPROVEDBY
Onderdonk/Corporate
StrategicPlanning
Feb.18,2010
FILEINFO
LASTFILECHANGEMADEBY
S04A09XOMSAR-
EnergyDemand.ai
Carol James Bill
INF&OONPAGE
INSARONPAGE
Note:
S04A
Includeslinkfile
Dataasof10/28/2009
Oil Gas Coal NuclearBiom Hydro Wind
1/1/80 128.1 54.7 70.3 7.4 29.5 6.4 0.1
1/1/81 123.5 54.3 70.4 8.7 30 6.6 0.1
1/1/82 120.5 53.8 70.7 9.5 30.7 6.7 0.2
1/1/83 120 54.2 72.5 10.7 31.3 7.1 0.2
1/1/84 122.1 58.2 75.5 13 32.4 7.4 0.3
1/1/85 121.9 60.1 77.8 15.5 32.9 7.6 0.3
1/1/86 125.5 61.2 78.4 16.6 33.3 7.8 0.3
1/1/87 128.2 64 81.9 18 34.1 7.9 0.4
1/1/88 132.8 66.6 84.6 19.6 34.5 8.1 0.4
1/1/89 134.7 70.2 85.8 20.1 35 8.3 0.4
1/1/90 136.6 72 86.2 20.9 35 8.7 0.5
1/1/91 137.6 74.5 85.6 21.8 35.6 8.9 0.5
1/1/92 139.1 74.2 84 22 36.7 9 0.5
1/1/93 138.8 75.2 84.1 22.7 36.7 9.4 0.5
1/1/94 141 75.6 84.7 23.2 37.3 9.5 0.6
1/1/95 144.2 78 88.2 24.1 38.1 9.9 0.6
1/1/96 147.8 81.7 89.7 25 38.7 10.1 0.5
1/1/97 150.8 83.1 89.4 24.8 39.2 10.3 0.6
1/1/98 152 83.6 89 25.3 39.7 10.4 0.6
1/1/99 155.4 86.3 87.3 26.2 40.4 10.6 0.7
1/1/00 156.4 88.9 89.7 26.8 41.1 10.8 0.7
1/1/01 157.7 89.2 90.3 27.3 41.3 10.6 0.8
1/1/02 159.3 91.7 92.4 27.5 42.1 10.6 0.9
1/1/03 162.6 95.5 99.2 27.3 43.3 10.8 1.1
1/1/04 168.3 98.1 107 28.3 44.3 11.4 1.3
1/1/05 171.1 100.4 112.3 28.6 45.1 11.8 1.5
1/1/06 173 102.5 118.8 28.9 46.1 12.2 2
1/1/07 174.3 106 124.7 28.3 47.1 12.4 2.5
1/1/08 173.2 107.7 126.3 28.4 48.1 12.8 3.2
1/1/09 168.2 104.3 117.5 28.7 47 12.5 3.7
1/1/10 170.4 107.5 119.9 29.2 47.6 12.9 4.3
1/1/11 172.7 110.5 122.3 30.1 48 13.2 4.7
1/1/15 181.5 120.1 127.9 33.5 49.3 14.8 6.8
1/1/19 188.5 129.3 128.4 37.3 50 16.3 8.8
1/1/20 190 131.9 128.2 38.4 50.1 16.7 9.3
1/1/30 206.9 156.9 127 50.9 51.2 20.1 15.4
Artist’snote:
Mostartificially
adjust2020-2030
DatapickedupfromEnergyOutlooksection.
Carol
0
100
200
300
400
500
600
700
Wind,Solar,Biofuels
Hydro/Geo
Biomass/Other
Nuclear
Coal
Gas
Oilexbio
1/1/301/1/201/1/101/1/091/1/081/1/071/1/061/1/051/1/041/1/031/1/021/1/011/1/001/1/901/1/80
1980 2005
GlobalEnergyDemand
(quadrillion BTUs)
700
600
500
400
300
200
100
2030
1.2%
Average Growth per Year
2005–2030
Gas
Oil
Coal
Other
1980 2005
Energy-Related CO
2
Emissions by Sector
(billion tonnes)
40
30
20
10
2030
0.9%
Average Growth per Year
2005–2030
Residential/
Commercial
Transportation
Industrial
Power Generation
EricWhetstone•WhetstoneDesignLab
office:214-788-6336•cell:
EDITOR
TraceyGunnlaugsson•InvestorRelations
ExxonMobilCorporation,Irving,TX
office:972-444-1151•cell:972-849-6202
CarolZuber-Mallison•ZMGraphics
studio/cell:214-906-4162•fax:817-924-7784
ATTENTION:OWNER VERSION
APPROVEDBY
FILEINFO
LASTFILECHANGEMADEBY
S04B09XOMSAR-
INF&OONPAGE
INSARONPAGE
Note:
Includeslinkfile
Because we want to ensure that today’s progress does not come at the expense of future generations,
we need to manage the risks to our environment. This includes taking meaningful steps to curb global
greenhouse gas (GHG) emissions, while also utilizing local resources to help maintain secure supplies.
Balancing the need for energy and economic
growth while addressing environmental risks is
a key challenge for society.
EXXONMOBILCORPORATION • 2009SUMMARYANNUALREPORT
4