Experian 2016 Annual Report Download - page 155
Download and view the complete annual report
Please find page 155 of the 2016 Experian annual report below. You can navigate through the pages in the report by either clicking on the pages listed below, or by using the keyword search tool below to find specific information within the annual report.-
 1
1 -
2
-
3
-
4
-
5
-
6
-
7
-
8
-
9
-
10
-
11
-
12
-
13
-
14
-
15
-
16
-
17
-
18
-
19
-
20
-
21
-
22
-
23
-
24
-
25
-
26
-
27
-
28
-
29
-
30
-
31
-
32
-
33
-
34
-
35
-
36
-
37
-
38
-
39
-
40
-
41
-
42
-
43
-
44
-
45
-
46
-
47
-
48
-
49
-
50
-
51
-
52
-
53
-
54
-
55
-
56
-
57
-
58
-
59
-
60
-
61
-
62
-
63
-
64
-
65
-
66
-
67
-
68
-
69
-
70
-
71
-
72
-
73
-
74
-
75
-
76
-
77
-
78
-
79
-
80
-
81
-
82
-
83
-
84
-
85
-
86
-
87
-
88
-
89
-
90
-
91
-
92
-
93
-
94
-
95
-
96
-
97
-
98
-
99
-
100
-
101
-
102
-
103
-
104
-
105
-
106
-
107
-
108
-
109
-
110
-
111
-
112
-
113
-
114
-
115
-
116
-
117
-
118
-
119
-
120
-
121
-
122
-
123
-
124
-
125
-
126
-
127
-
128
-
129
-
130
-
131
-
132
-
133
-
134
-
135
-
136
-
137
-
138
-
139
-
140
-
141
-
142
-
143
-
144
-
 145
145 -
 146
146 -
 147
147 -
 148
148 -
 149
149 -
 150
150 -
 151
151 -
 152
152 -
 153
153 -
 154
154 -
 155
155 -
 156
156 -
 157
157 -
 158
158 -
 159
159 -
 160
160 -
 161
161 -
 162
162 -
 163
163 -
 164
164 -
 165
165 -
166
-
167
-
168
-
169
-
170
-
171
-
172
-
173
-
174
-
175
-
176
-
177
-
178
-
179
-
180
-
181
-
182
-
183
-
184
-
185
-
186
-
187
-
188
 |
 |

153•Notes to the Group nancial statementsFinancial statements
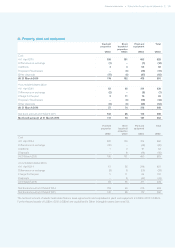
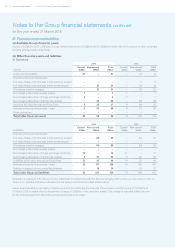
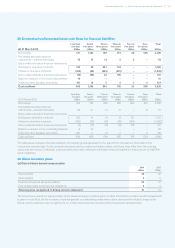
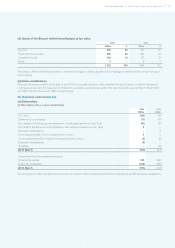
(ii) Fair value and notional principal amounts of derivative financial instruments
2016 2015
Assets Liabilities Assets Liabilities
Fair value
US$m
Notional
US$m
Fair value
US$m
Notional
US$m
Fair value
US$m
Notional
US$m
Fair value
US$m
Notional
US$m
Cross currency swaps – – 80 1,347 5 640 94 707
Interest rate swaps 53 1,475 39 2,349 46 1,364 35 2,423
Equity swaps 1 12 – – 1 9 – 8
Foreign exchange contracts 4 157 10 301 7 169 11 477
58 1,644 129 3,997 59 2,182 140 3,615
Notional principal amounts are the amount of principal underlying the contract at the reporting dates.
(iii) Offsetting derivative financial assets and liabilities
Assets Liabilities
2016
US$m
2015
US$m
2016
US$m
2015
US$m
Reported in the Group balance sheet 58 59 129 140
Related amounts not offset in the Group balance sheet (39) (37) (39) (37)
Net amount 19 22 90 103
There are no amounts offset within the assets and liabilities reported in the Group balance sheet.
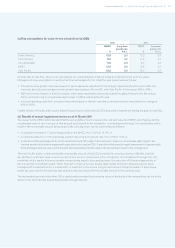
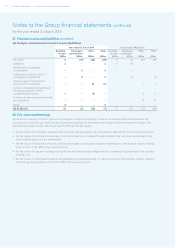
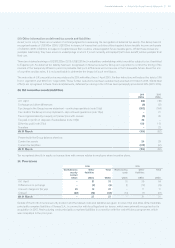
(c) Analysis by valuation method for items measured at fair value
2016 2015
Level 1
US$m
Level 2
US$m
Level 3
US$m
Total
US$m
Level 1
US$m
Level 2
US$m
Level 3
US$m
Total
US$m
Financial assets:
Derivatives used for hedging – 21 – 21 – 23 – 23
Assets at fair value through profit and loss – 37 – 37 – 36 – 36
Amounts reported as other financial assets (note 27(b)) – 58 – 58 – 59 – 59
Available-for-sale (note 27(a)) 33 – 10 43 35 – 5 40
33 58 10 101 35 59 5 99
Financial liabilities:
Derivatives used for hedging – (80) – (80) – (94) – (94)
Liabilities at fair value through profit and loss – (49) (17) (66) – (46) (33) (79)
–(129) (17) (146) – (140) (33) (173)
Net financial assets/(liabilities) 33 (71) (7) (45) 35 (81) (28) (74)
The analysis by level is a requirement of IFRS 13 and the definitions are summarised here for completeness:
• assets and liabilities whose valuations are based on unadjusted quoted prices in active markets for identical assets and liabilities
are classified as Level 1;
• assets and liabilities which are not traded in an active market and whose valuations are derived from available market data that is
observable for the asset or liability are classified as Level 2; and
• assets and liabilities whose valuations are derived from inputs not based on observable market data are classified as Level 3.
Level 3 items principally comprise contingent consideration and put and call options associated with corporate transactions.
Following a review of external reporting requirements in this area, amounts in respect of contingent consideration at 31 March 2016
of US$7m (2015: US$11m) have been included within the Level 3 analysis in this note and comparative information has been re-
presented as appropriate. The inputs used in determining valuations are a mix of earnings and asset valuations reflecting different
contractual arrangements. There would be no material effect on the amounts stated from any reasonably possible change in such
inputs at 31 March 2016.