Equifax 2002 Annual Report Download - page 2
Download and view the complete annual report
Please find page 2 of the 2002 Equifax annual report below. You can navigate through the pages in the report by either clicking on the pages listed below, or by using the keyword search tool below to find specific information within the annual report.-
 1
1 -
 2
2 -
 3
3 -
 4
4 -
 5
5 -
 6
6 -
 7
7 -
 8
8 -
 9
9 -
 10
10 -
 11
11 -
 12
12 -
 13
13 -
14
-
15
-
16
-
17
-
18
-
19
-
20
-
21
-
22
-
23
-
24
-
25
-
26
-
27
-
28
-
29
-
30
-
31
-
32
-
33
-
34
-
35
-
36
-
37
-
38
-
39
-
40
-
41
-
42
-
43
-
44
-
45
-
46
-
47
-
48
-
49
-
50
-
51
-
52
-
53
-
54
-
55
-
56
-
57
-
58
-
59
-
60
-
61
-
62
-
63
-
64
-
65
-
66
-
67
-
68
-
69
-
70
-
71
-
72
 |
 |

OUR BUSINESS DESCRIPTION
CONTENTS
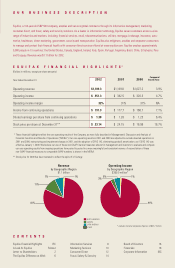
Equifax, a 104-year-old S&P 500 company, enables and secures global commerce through its information management, marketing,
consumer direct, and fraud, safety and security solutions. As a leader in information technology, Equifax serves customers across a wide
range of industries and markets, including: financial services, retail, telecommunications, utilities, mortgage, brokerage, insurance, auto-
motive, healthcare, direct marketing, government, security and transportation. Equifax also enlightens, enables and empowers consumers
to manage and protect their financial health with consumer direct services offered at www.equifax.com. Equifax employs approximately
5,000 people in 13 countries: the United States, Canada, England, Ireland, Italy, Spain, Portugal, Argentina, Brazil, Chile, El Salvador, Peru
and Uruguay. Revenue was $1.1 billion for 2002.
Equifax Financial Highlights IFC
A Look At Equifax Foldout
Letter to Shareholders 2
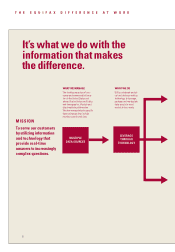
The Equifax Difference at Work 6
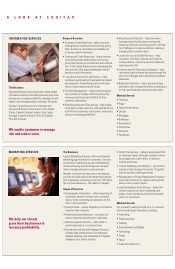
Information Services 8
Marketing Services 10
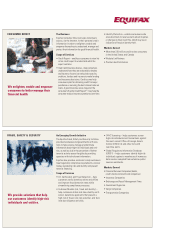
Consumer Direct 12
Fraud, Safety & Security 14
Board of Directors 16
Financials 18
Corporate Information IBC
Year Ended December 31
Operating revenue $1,109.3 $1,109.8 $1,027.2 3.9%
Operating income $351.3 $342.5 $ 320.3 4.7%
Operating income margin 32% 31% 31% NA
Income from continuing operations $191.3 $177.7 $ 166.7 7.1%
Diluted earnings per share from continuing operations $1.38 $1.28 $ 1.23 6.4%
Stock price per share at December 31** $23.14 $24.15 $ 16.98 16.7%
Compound
Growth Rate
2001 2000
** These financial highlights reflect the core operating results of the Company, as more fully described in Management’s Discussion and Analysis of
Financial Condition and Results of Operations (“MD&A”). Our core operating results in 2001 and 2000 are adjusted to exclude divested operations in
2001 and 2000, restructuring and impairment charges in 2001, and the adoption of SFAS 142, eliminating goodwill amortization, as if SFAS 142 was
effective January 1, 2000. We believe our use of these non-GAAP financial measures allows for management and investors to evaluate and compare
our core operating results from ongoing operations from period to period in a more meaningful and consistent manner. A reconciliation of these
non-GAAP financial measures to comparable GAAP numbers is shown in the MD&A.
** Stock price for 2000 has been restated to reflect the spin-off of Certegy.
EQUIFAX FINANCIAL HIGHLIGHTS
*
(Dollars in millions, except per share amounts)
2002
Revenue
by Geographic Region
$1.1 billion
Operating Income
by Geographic Region
$399.0 million*
NORTH AMERICA
EUROPE
LATIN AMERICA
OTHER
1%
* excludes General Corporate Expense of $47.7 million
91%
5%
3%
7%
11%
81%
1%