Epson 2011 Annual Report Download - page 5
Download and view the complete annual report
Please find page 5 of the 2011 Epson annual report below. You can navigate through the pages in the report by either clicking on the pages listed below, or by using the keyword search tool below to find specific information within the annual report.-
 1
1 -
 2
2 -
 3
3 -
 4
4 -
 5
5 -
 6
6 -
 7
7 -
 8
8 -
 9
9 -
 10
10 -
 11
11 -
 12
12 -
 13
13 -
 14
14 -
 15
15 -
 16
16 -
17
-
18
-
19
-
20
-
21
-
22
-
23
-
24
-
25
-
26
-
27
-
28
-
29
-
30
-
31
-
32
-
33
-
34
-
35
-
36
-
37
-
38
-
39
-
40
-
41
-
42
-
43
-
44
-
45
-
46
-
47
-
48
-
49
-
50
-
51
-
52
-
53
-
54
-
55
-
56
-
57
-
58
-
59
-
60
-
61
-
62
-
63
-
64
-
65
-
66
-
67
-
68
-
69
-
70
-
71
-
72
-
73
-
74
-
75
-
76
-
77
-
78
-
79
-
80
-
81
-
82
-
83
-
84
-
85
-
86
-
87
-
88
-
89
-
90
-
91
-
92
-
93
-
94
-
95
-
96
-
97
-
98
 |
 |

4
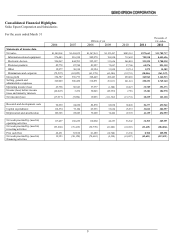
Millions of yen
Thousands of
U.S. dollars
2006 2007 2008 2009 2010 2011 2011
Balance sheet data
Current assets ¥795,402 ¥813,274 ¥737,245 ¥617,677 ¥596,210 ¥543,530 $6,536,741
Property, plant and equipment (net of
accumulated depreciation)
426,118 379,032 343,261 253,712 225,354 213,623 2,569,152
Total assets 1,325,206 1,284,412 1,139,165 917,342 870,090 798,229 9,599,867
Current liabilities 507,371 476,125 385,123 283,848 328,652 315,422 3,793,409
Noncurrent liabilities 311,610 313,952 282,595 314,862 258,574 211,999 2,549,597
Net assets 474,520 494,335 471,446 318,631 282,864 270,808 3,256,861
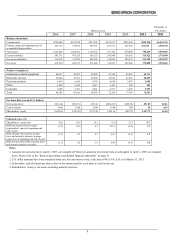
Number of employees
Information-related equipment 46,417 43,623 47,862 41,748 45,863 44,711
Electronic devices 32,849 32,551 29,609 19,818 22,439 20,659
Precision products 6,639 6,636 6,576 6,038 5,839 5,985
Other 2,208 2,455 2,417 2,151 590 245
Corporate 2,588 2,361 2,461 2,571 3,206 2,951
Total 90,701 87,626 88,925 72,326 77,936 74,551
Per share data (yen and U.S. dollars)
Net income (loss) (¥91.24) (¥36.13) ¥97.24 (¥566.92) (¥99.34) ¥51.25 $0.61
Cash dividends 29.00 32.00 32.00 35.00 7.00 20 0.24
Shareholders’ equity 2,416.54 2,395.14 2,277.45 1,541.16 1,407.92 1,347.71 16.20
Financial ratios (%)
Shareholders’ equity ratio 35.8 36.6 39.3 33.0 32.3 33.7
ROE (net income (loss)/average
shareholders’ equity at beginning and
end of yea
r
)
(3.8) (1.5) 4.2 (29.7) (6.8) 3.7
ROA (income (loss) before income
taxes and minority interests/ average
total assets at beginning and end of yea
r
)
(1.5) 0.3 4.3 (8.7) (0.1) 1.9
ROS (income (loss) before income taxes
and minority interes
t
/
net sales) (1.3) 0.2 3.9 (8.0) (0.1) 1.6
Notes
1. Amounts for periods prior to April 1, 2007, are rounded off. However, amounts for periods from or subsequent to April 1, 2007, are rounded
down. Please refer to the “Basis of presenting consolidated financial statements” on page 51.
2. U.S. dollar amounts have been translated from yen, for convenience only, at the rate of ¥83.15=U.S.$1 as of March 31, 2011.
3. In this table, cash dividends per share refers to the amount paid for each share in each fiscal year.
4. Shareholders’ equity is net assets excluding minority interests.