Epson 2011 Annual Report Download - page 4
Download and view the complete annual report
Please find page 4 of the 2011 Epson annual report below. You can navigate through the pages in the report by either clicking on the pages listed below, or by using the keyword search tool below to find specific information within the annual report.-
 1
1 -
 2
2 -
 3
3 -
 4
4 -
 5
5 -
 6
6 -
 7
7 -
 8
8 -
 9
9 -
 10
10 -
 11
11 -
 12
12 -
 13
13 -
 14
14 -
 15
15 -
16
-
17
-
18
-
19
-
20
-
21
-
22
-
23
-
24
-
25
-
26
-
27
-
28
-
29
-
30
-
31
-
32
-
33
-
34
-
35
-
36
-
37
-
38
-
39
-
40
-
41
-
42
-
43
-
44
-
45
-
46
-
47
-
48
-
49
-
50
-
51
-
52
-
53
-
54
-
55
-
56
-
57
-
58
-
59
-
60
-
61
-
62
-
63
-
64
-
65
-
66
-
67
-
68
-
69
-
70
-
71
-
72
-
73
-
74
-
75
-
76
-
77
-
78
-
79
-
80
-
81
-
82
-
83
-
84
-
85
-
86
-
87
-
88
-
89
-
90
-
91
-
92
-
93
-
94
-
95
-
96
-
97
-
98
 |
 |

3
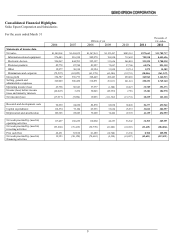
Consolidated Financial Highlights
Seiko Epson Corporation and Subsidiaries
For the years ended March 31
Millions of yen
Thousands of
U.S. dollars
2006 2007 2008 2009 2010 2011 2011
Statements of income data
Net sales ¥1,549,568 ¥1,416,032 ¥1,347,841 ¥1,122,497 ¥985,363 ¥973,663 $11,709,717
Information-related equipment 976,443 916,330 902,970 769,850 712,692 702,918 8,453,626
Electronic devices 526,967 444,703 395,197 311,626 248,001 231,235 2,780,938
Precision products 85,778 87,744 83,927 72,697 57,746 68,276 821,118
Other 32,977 30,310 29,124 31,828 19,714 1,279 15,382
Eliminations and corporate (72,597) (63,055) (63,378) (63,506) (52,791) (30,046) (361,347)
Gross profit 354,787 356,773 368,449 289,443 259,469 262,963 3,162,513
Selling, general and
administrative expenses 329,029 306,430 310,871 291,031 241,241 230,253 2,769,140
Operating income (loss) 25,758 50,343 57,577 (1,588) 18,227 32,709 393,373
Income (loss) before income
taxes and minority interests (20,047) 3,476 52,045 (89,559) (799) 15,381 184,978
Net income (loss) (17,917) (7,094) 19,093 (111,322) (19,791) 10,239 123,138
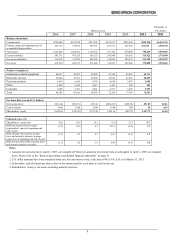
Research and development costs 92,939 84,690 82,870 82,058 68,849 54,377 653,962
Capital expenditures 112,574 73,104 63,955 55,624 25,937 31,813 382,597
Depreciation and amortization 109,305 89,603 79,209 78,406 47,395 41,159 494,999
Net cash provided by (used in)
operating activities 117,497 160,229 112,060 44,253 56,542 32,395 389,597
Net cash provided by (used in)
investing activities (95,266) (76,419) (50,770) (61,002) (43,203) (23,615) (284,004)
Free cash flow 22,231 83,810 61,289 (16,748) 13,338 8,780 105,592
Net cash provided by (used in)
financing activities
19,123 (30,150) (70,663) (9,558) (41,087) (42,691) (513,421)