DuPont 2006 Annual Report Download - page 17
Download and view the complete annual report
Please find page 17 of the 2006 DuPont annual report below. You can navigate through the pages in the report by either clicking on the pages listed below, or by using the keyword search tool below to find specific information within the annual report.-
 1
1 -
2
-
3
-
4
-
5
-
6
-
 7
7 -
 8
8 -
 9
9 -
 10
10 -
 11
11 -
 12
12 -
 13
13 -
 14
14 -
 15
15 -
 16
16 -
 17
17 -
 18
18 -
 19
19 -
 20
20 -
 21
21 -
 22
22 -
 23
23 -
 24
24 -
 25
25 -
 26
26 -
 27
27 -
28
-
29
-
30
-
31
-
32
-
33
-
34
-
35
-
36
-
37
-
38
-
39
-
40
-
41
-
42
-
43
-
44
-
45
-
46
-
47
-
48
-
49
-
50
-
51
-
52
-
53
-
54
-
55
-
56
-
57
-
58
-
59
-
60
-
61
-
62
-
63
-
64
-
65
-
66
-
67
-
68
-
69
-
70
-
71
-
72
-
73
-
74
-
75
-
76
-
77
-
78
-
79
-
80
-
81
-
82
-
83
-
84
-
85
-
86
-
87
-
88
-
89
-
90
-
91
-
92
-
93
-
94
-
95
-
96
-
97
-
98
-
99
-
100
-
101
-
102
-
103
-
104
-
105
-
106
-
107
-
108
-
109
-
110
-
111
-
112
-
113
-
114
-
115
-
116
-
117
-
118
-
119
-
120
-
121
-
122
-
123
 |
 |

Item 5. Market for Registrant’s Common Equity, Related Stockholder Matters and Issuer Purchases of Equity
Securities, continued
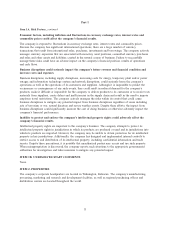
Stock Performance Graph
The following graph presents the cumulative five-year total return for the company’s common stock compared
with the S&P 500 Stock Index and a self-constructed peer group of companies. The peer group companies are
Alcoa Inc.; BASF Corporation; The Dow Chemical Company; Eastman Kodak Company; Ford Motor
Company; General Electric Company; Hewlett-Packard Company; Minnesota Mining and Manufacturing
Company; Monsanto Company; Motorola, Inc.; PPG Industries, Inc.; Rohm and Haas Company; and United
Technologies Corporation.
Stock Performance Graph
200620052004200320022001
$60
$70
$80
$90
$100
$110
$120
$130
$140
DuPont
S&P 500
Peer Group
12/31/2001 12/31/2002 12/31/2003 12/31/2004 12/31/2005 12/31/2006
DuPont $100 $103 $115 $127 $114 $135
S&P 500 $100 $ 78 $100 $111 $117 $135
Industry Peer Group $100 $ 72 $100 $115 $119 $133
The graph assumes that the value of DuPont Common Stock, the S&P 500 Stock Index and the peer group of
companies was each $100 on December 31, 2001 and that all dividends were reinvested. The peer group is
weighted by market capitalization.
17
Part II