Dow Chemical 2013 Annual Report Download - page 12
Download and view the complete annual report
Please find page 12 of the 2013 Dow Chemical annual report below. You can navigate through the pages in the report by either clicking on the pages listed below, or by using the keyword search tool below to find specific information within the annual report.-
 1
1 -
 2
2 -
 3
3 -
 4
4 -
 5
5 -
 6
6 -
 7
7 -
 8
8 -
 9
9 -
 10
10 -
 11
11 -
 12
12 -
 13
13 -
 14
14 -
 15
15 -
 16
16 -
 17
17 -
 18
18 -
 19
19 -
 20
20 -
 21
21 -
 22
22 -
23
-
24
-
25
-
26
-
27
-
28
-
29
-
30
-
31
-
32
-
33
-
34
-
35
-
36
-
37
-
38
-
39
-
40
-
41
-
42
-
43
-
44
-
45
-
46
-
47
-
48
-
49
-
50
-
51
-
52
-
53
-
54
-
55
-
56
-
57
-
58
-
59
-
60
-
61
-
62
-
63
-
64
-
65
-
66
-
67
-
68
-
69
-
70
-
71
-
72
-
73
-
74
-
75
-
76
-
77
-
78
-
79
-
80
-
81
-
82
-
83
-
84
-
85
-
86
-
87
-
88
-
89
-
90
-
91
-
92
-
93
-
94
-
95
-
96
-
97
-
98
-
99
-
100
-
101
-
102
-
103
-
104
-
105
-
106
-
107
-
108
-
109
-
110
-
111
-
112
-
113
-
114
-
115
-
116
-
117
-
118
-
119
-
120
-
121
-
122
-
123
-
124
-
125
-
126
-
127
-
128
-
129
-
130
-
131
-
132
-
133
-
134
-
135
-
136
-
137
-
138
-
139
-
140
-
141
-
142
-
143
-
144
-
145
-
146
-
147
-
148
-
149
-
150
-
151
-
152
-
153
-
154
-
155
-
156
-
157
-
158
-
159
-
160
-
161
-
162
-
163
-
164
-
165
-
166
-
167
-
168
-
169
-
170
-
171
-
172
-
173
-
174
-
175
-
176
-
177
-
178
-
179
-
180
-
181
-
182
-
183
-
184
 |
 |

10 The Dow Chemical Company
Buig Vue Thrgh
In an unpredictable global business environment, we are driving higher operating performance across
our enterprise. Our strengthened balance sheet and ongoing execution of business-specific actions
to improve return on capital demonstrate how Dow continues to leverage operational productivity to
accelerate value. This in turn enables us to focus our resources more deeply in high-growth businesses,
enhance financial flexibility and increasingly reward our shareholders.
Op d l Ec
Strengthening Our Balance Sheet
to Reward Shareholders
In2013,wecontinuedtoidentifynewwaystorelease
morecashandvaluefromourbalancesheet,while
reducingdebtandinterestexpense.
• In2013,wegenerated$7.8billionincashowfrom
operations–representinganewrecord,evenexcluding
theafter-taximpactofthecashpaymentfrom
PetrochemicalIndustriesCompany(PIC)ofKuwait.
• Additionally,themajorityofthisapproximately
$2.2billioncashawardreceivedin2013wasallocated
towardpayingdowndebt,helpingtobringourdebt
toequityratioswellbelowhistoriclevelsandreducing
ourinterestexpense$170millionyearoveryear.
• Overthepastthreeyears,Dowhasmorethandoubled
shareholderreturnsintheformofdeclareddividends
andsharerepurchases.Asourcashowandearnings
continuetogrow,weremainfocusedonrewarding
shareholdersandfundingorganicgrowth.
Improving Return on Capital
Ourongoingexecutionofourrestructuringactions
coupledwiththeprioritizationofourgrowthinvestments
reinforceourcommitmenttoenhancingreturnoncapital
andimprovingoveralloperatingperformance.
• Weacceleratedourcostsavingsandportfolio
managementactionsthroughouttheyear,
exceedingourgoaltodeliver$500millionin
costreductionsin2013.
• Weadvancedkeygrowthinitiativeswiththemajority
ofourforwardcapitalallocationputtowardthese
high-returnprojects.Thishasenabledastrongbridge
tonewearningsstreamsthatwillcontinuetoramp
upin2015wheninvestmentsinSadaraandournew
PDHunitontheU.S.GulfCoastcomeonline.
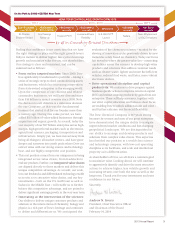
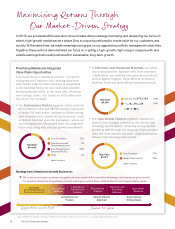
Clear Cash Priorities
(dollars in billions)
Cash Flow from Operations
Net Debt to EBITDA1
Net Debt to EBITDA
Cash Flow from Operations ($B)
$8.0
$7.0
$6.0
$5.0
$4.0
$3.0
$2.0
$1.0
$0.0
4.0
3.5
3.0
2.5
2.0
1.5
1.0
0.5
0.0
20102009 2011 2012 2013
Accelerate Share Repurchases
Expanded programs to $4.5B
Increase Dividend
15% increase in 1Q14 dividend
High-Return Organic Growth
CapEx of $3.3B$3.5B in 2014
Record cash flow from operations
$7.8B in 2013
Stronger balance sheet
1.4 net debt to EBITDA
Non-strategic business and
asset divestitures
$3B$4B in 201315
After-tax Impact
of KDow Award
q Increasing cash flow and a stronger balance sheet enable increased
remuneration and funding for high-return growth projects.
1 Net debt to EBITDA is defined as net debt divided by “Adjusted EBITDA.” Net debt equals total debt (“Notes Payable”
plus “Long-term debt due within one year” plus “Long-term debt”) minus “Cash and cash equivalents.”