Dominion Power 2003 Annual Report Download - page 14
Download and view the complete annual report
Please find page 14 of the 2003 Dominion Power annual report below. You can navigate through the pages in the report by either clicking on the pages listed below, or by using the keyword search tool below to find specific information within the annual report.-
 1
1 -
2
-
3
-
 4
4 -
 5
5 -
 6
6 -
 7
7 -
 8
8 -
 9
9 -
 10
10 -
 11
11 -
 12
12 -
 13
13 -
 14
14 -
 15
15 -
 16
16 -
 17
17 -
 18
18 -
 19
19 -
 20
20 -
 21
21 -
 22
22 -
 23
23 -
 24
24 -
25
-
26
-
27
-
28
-
29
-
30
-
31
-
32
-
33
-
34
-
35
-
36
-
37
-
38
-
39
-
40
-
41
-
42
-
43
-
44
-
45
-
46
-
47
-
48
-
49
-
50
-
51
-
52
-
53
-
54
-
55
-
56
-
57
-
58
-
59
-
60
-
61
-
62
-
63
-
64
-
65
-
66
-
67
-
68
-
69
-
70
-
71
-
72
-
73
-
74
-
75
-
76
-
77
-
78
-
79
-
80
-
81
-
82
-
83
-
84
-
85
-
86
-
87
-
88
-
89
-
90
-
91
-
92
-
93
-
94
-
95
-
96
-
97
-
98
-
99
-
100
-
101
-
102
-
103
-
104
 |
 |

12.Dominion 2003
Managing Our Businesses
As a Btu Balance Sheet
Deregulation opens unique opportunities because we own
electric generation and natural gas assets. Both forms can
be measured in British Thermal Units, or Btus. Think of
our businesses as a Btu balance sheet — assets on the
left; “liabilities,” or obligations to customers, on the right.
Our “assets” are megawatts and natural gas
reserves that make up the supply side of our portfolio.
Our Btu obligations include customer-supply obligations,
forward sales contracts with credit-worthy institutions and
financial hedges, which are agreements to sell energy at
a certain price on a future date.
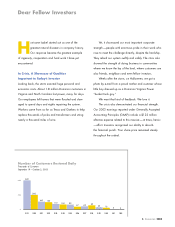
By the end of 2003, we had matched 90 percent of
our electric generation with our retail and wholesale cus-
tomers. We also hedged or locked in the prices we expect
to get for more than 80 percent of our 2004 natural gas
and oil production, reducing our exposure to price volatil-
ity in wholesale natural gas and power markets.
If gas prices spike up or down, we have less to
make or less to lose. In a boom-or-bust scenario, we’ll
make a margin.
Creating Profits, Cash Through Commodity
Volatility, Growing “Internal Hedge”
I have a name for the 10 percent of generation that we
have not matched and the 20 percent of natural gas that
we have not hedged — “Btu equity.”
Btu equity gives us flexibility. We can create more
cash and profits by taking advantage of interconnections
between natural gas and competitive power markets.
Think of a child’s seesaw: When natural gas prices rise,
it costs us more to generate power in our merchant
gas-fired units. Therefore, the profit margins earned on
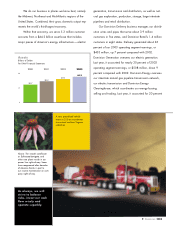
Baseload 50%
Intermediate 28%
Peaking 22%
Generation:
Unit Mix
As of Year End
Gas/Other 28%
Coal 26%
Nuclear 21%
Purchases 15%
Oil 10%
Generation:
Fuel Mix
As of Year End
25,000
12,500
0
24,408
21,867
23,830
Electric Generation Capacity Growth
Megawatts
As of Year End
20032001
19,265
2000 2002