Creative 2015 Annual Report Download - page 4
Download and view the complete annual report
Please find page 4 of the 2015 Creative annual report below. You can navigate through the pages in the report by either clicking on the pages listed below, or by using the keyword search tool below to find specific information within the annual report.-
 1
1 -
 2
2 -
 3
3 -
 4
4 -
 5
5 -
 6
6 -
 7
7 -
 8
8 -
 9
9 -
 10
10 -
 11
11 -
 12
12 -
 13
13 -
 14
14 -
 15
15 -
16
-
17
-
18
-
19
-
20
-
21
-
22
-
23
-
24
-
25
-
26
-
27
-
28
-
29
-
30
-
31
-
32
-
33
-
34
-
35
-
36
-
37
-
38
-
39
-
40
-
41
-
42
-
43
-
44
-
45
-
46
-
47
-
48
-
49
-
50
-
51
-
52
-
53
-
54
-
55
-
56
-
57
-
58
-
59
-
60
-
61
-
62
-
63
-
64
 |
 |

4
CREATIVE TECHNOLOGY LTD AND ITS SUBSIDIARIES
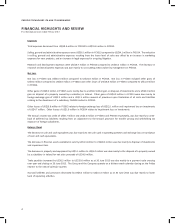
Expenses
Total expenses decreased from US$59.6 million in FY2014 to US$55.8 million in FY2015.
Selling, general and administrave expenses were US$36.1 million in FY2015 compared to US$34.1 million in FY2014. The reducon
in selling, general and administrave expenses resulng from the lower level of sales was oset by an increase in markeng
expenses for new products, and an increase in legal expenses for on-going ligaon.
Research and development expenses were US$19.7 million in FY2015 compared to US$25.5 million in FY2014. The decrease in
research and development expenses was due mainly to cost cung acons taken by management in FY2014.
Net Loss
Net loss in FY2015 was US$33.4 million compared to US$21.8 million in FY2014. Net loss in FY2015 included other gains of
US$9.6 million compared to US$4.0 million in FY2014 and other losses of US$16.8 million in FY2015 compared to US$1.0 million
in FY2014.
Other gains of US$9.6 million in FY2015 were mainly due to a US$9.2 million gain on disposal of investments and a US$0.4 million
gain on disposal of a property owned by a subsidiary in Ireland. Other gains of US$4.0 million in FY2014 were due mainly to
foreign exchange gain of US$2.2 million and a US$1.5 million reversal of provisions upon nalisaon of all costs and liabilies
relang to the divestment of a subsidiary, ZiiLABS Limited in FY2013.
Other losses of US$16.8 million in FY2015 relates to foreign exchange loss of US$12.1 million and impairment loss on investments
of US$4.7 million. Other losses of US$1.0 million in FY2014 relates to impairment loss on investments.
The Group’s income tax credit of US$0.7 million and US$4.5 million in FY2015 and FY2014 respecvely, was due mainly to write-
back of deferred tax liabilies resulng from an adjustment to the Group’s provision for transfer pricing and withholding tax
exposure of foreign subsidiaries.
Balance Sheet
The decrease in cash and cash equivalents was due mainly to net cash used in operang acvies and exchange loss on translaon
of cash and cash equivalents.
The decrease in nancial assets available-for-sale by US$3.4 million to US$18.2 million was due mainly to disposal of investments
and impairment loss.
The decrease in property and equipment by US$5.1 million to US$1.4 million was due mainly to the disposal of a property owned
by a subsidiary in Ireland for net sales proceeds of US$4.9 million.
Trade payables increased by US$6.2 million to US$15.6 million as at 30 June 2015 was due mainly to a payment cycle crossing
over year end closing on 26 June 2015. The Group and the Company operate on a thirteen week calendar closing on the Friday
nearest to the natural calendar quarter.
Accrued liabilies and provisions decreased by US$6.5 million to US$31.4 million as at 30 June 2015 was due mainly to lower
level of operang acvies.
FINANCIAL HIGHLIGHTS AND REVIEW
For the nancial year ended 30 June 2015