Creative 2015 Annual Report Download - page 3
Download and view the complete annual report
Please find page 3 of the 2015 Creative annual report below. You can navigate through the pages in the report by either clicking on the pages listed below, or by using the keyword search tool below to find specific information within the annual report.-
 1
1 -
 2
2 -
 3
3 -
 4
4 -
 5
5 -
 6
6 -
 7
7 -
 8
8 -
 9
9 -
 10
10 -
 11
11 -
 12
12 -
 13
13 -
 14
14 -
15
-
16
-
17
-
18
-
19
-
20
-
21
-
22
-
23
-
24
-
25
-
26
-
27
-
28
-
29
-
30
-
31
-
32
-
33
-
34
-
35
-
36
-
37
-
38
-
39
-
40
-
41
-
42
-
43
-
44
-
45
-
46
-
47
-
48
-
49
-
50
-
51
-
52
-
53
-
54
-
55
-
56
-
57
-
58
-
59
-
60
-
61
-
62
-
63
-
64
 |
 |

3
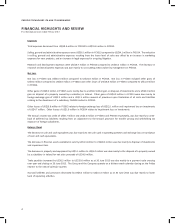
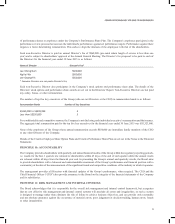
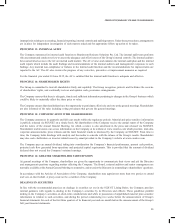
CREATIVE TECHNOLOGY LTD AND ITS SUBSIDIARIES
Overview
US$million
2015 2014
Sales, net 99.5 116.3
Gross prot 28.5 30.1
Gross prot margin 29% 26%
Expenses 55.8 59.6
Net loss 33.4 21.8
Sales for the nancial year ended 30 June 2015 (“FY2015”) were US$99.5 million compared to US$116.3 million for the
nancial year ended 30 June 2014 (“FY2014”). Gross prot in FY2015 was US$28.5 million at a margin of 29% compared
to US$30.1 million at a margin of 26% in FY2014. Net loss in FY2015 was US$33.4 million compared to US$21.8 million
in FY2014.
Sales
The Group’s sales decreased by 14% to US$99.5 million in FY2015 compared to US$116.3 million in FY2014. Sales were
lower in FY2015 due to the uncertain and difcult market conditions which affected the sales of the Group’s products and
impacted sales across all three geographical regions.
US$million
Sales by Product Category 2015 2014
Audio, speakers and headphones 90.2 103.5
Personal digital entertainment 5.1 8.2
Other products 4.2 4.6
99.5 116.3
Sales of all product categories in FY2015 have decreased compared to FY2014.
US$million
Sales by Region 2015 2014
Asia Pacic 51.7 59.3
The Americas 16.7 17.2
Europe 31.1 39.8
99.5 116.3
By geographical region, the decrease in sales in FY2015 was across all three regions at 13%, 3% and 22% in Asia Pacic, the
Americas and Europe region respecvely. As a percentage of total sales, sales in the Asia Pacic region was 52% in FY2015
compared to 51% in FY2014. Sales in the Americas region were 17% of total sales in FY2015 compared to 15% in FY2014 and
sales in the Europe region were 31% of total sales in FY2015 compared to 34% in FY2014.
Gross Prot
Gross prot was US$28.5 million in FY2015 compared to US$30.1 million in FY2014. Gross prot for FY2015 was in line with the
sales mix. Gross prot margin as a percentage of sales was 29% in FY2015 compared to 26% in FY2014.
FINANCIAL HIGHLIGHTS AND REVIEW
For the nancial year ended 30 June 2015