Costco 2002 Annual Report Download - page 41
Download and view the complete annual report
Please find page 41 of the 2002 Costco annual report below. You can navigate through the pages in the report by either clicking on the pages listed below, or by using the keyword search tool below to find specific information within the annual report.-
 1
1 -
2
-
3
-
4
-
5
-
6
-
7
-
8
-
9
-
10
-
11
-
12
-
13
-
14
-
15
-
16
-
17
-
18
-
19
-
20
-
21
-
22
-
23
-
24
-
25
-
26
-
27
-
28
-
29
-
30
-
 31
31 -
 32
32 -
 33
33 -
 34
34 -
 35
35 -
 36
36 -
 37
37 -
 38
38 -
 39
39 -
 40
40 -
 41
41 -
 42
42 -
 43
43 -
 44
44 -
 45
45 -
 46
46 -
 47
47
 |
 |

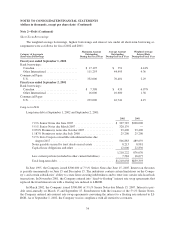
NOTES TO CONSOLIDATED FINANCIAL STATEMENTS
(dollars in thousands, except per share data) (Continued)
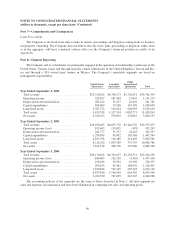
Note 7—Commitments and Contingencies
Legal Proceedings
The Company is involved from time to time in claims, proceedings and litigation arising from its business
and property ownership. The Company does not believe that any such claim, proceeding or litigation, either alone
or in the aggregate, will have a material adverse effect on the Company’s financial position or results of its
operations.
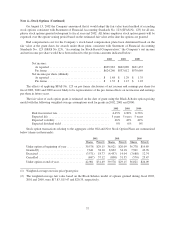
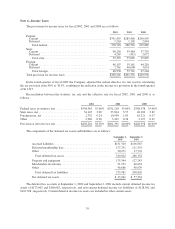
Note 8—Segment Reporting
The Company and its subsidiaries are principally engaged in the operation of membership warehouses in the
United States, Canada, Japan and through majority-owned subsidiaries in the United Kingdom, Taiwan and Ko-
rea and through a 50%-owned joint venture in Mexico. The Company’s reportable segments are based on
management responsibility.
United States
Operations
Canadian
Operations
Other
International
Operations Total
Year Ended September 1, 2002
Totalrevenue................................ $32,310,812 $4,750,173 $1,701,514 $38,762,499
Operating income ............................ 929,027 187,464 15,044 1,131,535
Depreciation and amortization .................. 281,812 33,477 26,492 341,781
Capital expenditures .......................... 868,069 35,098 135,438 1,038,605
Long lived assets ............................. 5,387,772 514,854 620,993 6,523,619
Total assets ................................. 9,459,538 1,157,954 1,002,771 11,620,263
Net assets ................................... 4,526,525 576,693 591,019 5,694,237
Year Ended September 2, 2001
Totalrevenue................................ $28,636,483 $4,695,778 $1,464,776 $34,797,037
Operating income (loss) ....................... 813,665 179,095 (493) 992,267
Depreciation and amortization .................. 241,777 35,377 24,143 301,297
Capital expenditures .......................... 1,298,889 43,092 105,568 1,447,549
Long lived assets ............................. 4,835,598 516,489 474,498 5,826,585
Total assets ................................. 8,216,242 1,093,789 779,755 10,089,786
Net assets ................................... 3,811,158 548,196 523,586 4,882,940
Year Ended September 3, 2000
Totalrevenue................................ $26,170,108 $4,743,657 $1,250,531 $32,164,296
Operating income (loss) ....................... 848,605 192,310 (3,465) 1,037,450
Depreciation and amortization .................. 198,436 36,563 19,398 254,397
Capital expenditures .......................... 998,429 41,962 188,030 1,228,421
Long lived assets ............................. 3,870,626 534,145 429,345 4,834,116
Total assets ................................. 6,833,440 1,134,998 665,502 8,633,940
Net assets ................................... 3,454,330 322,205 463,745 4,240,280
The accounting policies of the segments are the same as those described in Note 1. All inter-segment net
sales and expenses are immaterial and have been eliminated in computing net sales and operating profit.
40