Cogeco 2013 Annual Report Download - page 5
Download and view the complete annual report
Please find page 5 of the 2013 Cogeco annual report below. You can navigate through the pages in the report by either clicking on the pages listed below, or by using the keyword search tool below to find specific information within the annual report.-
 1
1 -
 2
2 -
 3
3 -
 4
4 -
 5
5 -
 6
6 -
 7
7 -
 8
8 -
 9
9 -
 10
10 -
 11
11 -
 12
12 -
 13
13 -
 14
14 -
 15
15 -
 16
16 -
17
-
18
-
19
-
20
-
21
-
22
-
23
-
24
-
25
-
26
-
27
-
28
-
29
-
30
-
31
-
32
-
33
-
34
-
35
-
36
-
37
-
38
-
39
-
40
-
41
-
42
-
43
-
44
-
45
-
46
-
47
-
48
-
49
-
50
-
51
-
52
-
53
-
54
-
55
-
56
-
57
-
58
-
59
-
60
-
61
-
62
-
63
-
64
-
65
-
66
-
67
-
68
-
69
-
70
-
71
-
72
-
73
-
74
-
75
-
76
-
77
-
78
-
79
-
80
-
81
-
82
-
83
-
84
-
85
-
86
-
87
-
88
-
89
-
90
-
91
-
92
-
93
-
94
-
95
-
96
-
97
-
98
 |
 |

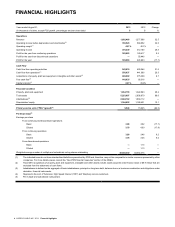
4 COGECO CABLE INC. 2013 Financial highlights
FINANCIAL HIGHLIGHTS
Years ended August 31, 2013 2012 Change
(in thousands of dollars, except PSU growth, percentages and per share data) $$ %
Operations
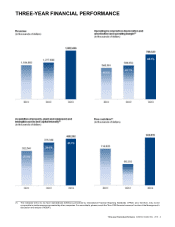
Revenue 1,692,466 1,277,698 32.5
Operating income before depreciation and amortization(1) 780,523 589,052 32.5
Operating margin(1) 46.1% 46.1% —
Operating income 376,239 312,180 20.5
Profit for the year from continuing operations 185,083 169,517 9.2
Profit for the year from discontinued operations —55,446 —
Profit for the year 185,083 224,963 (17.7)
Cash Flow
Cash flow from operating activities 545,010 450,386 21.0
Cash flow from operations(1) 558,037 441,686 26.3
Acquisitions of property, plant and equipment, intangible and other assets(2) 408,202 375,368 8.7
Free cash flow(1) 149,835 66,318 —
Capital intensity(1) 24.1% 29.4% —
Financial Condition
Property, plant and equipment 1,854,155 1,322,093 40.2
Total assets 5,253,097 2,908,079 80.6
Indebtedness(3) 2,944,182 1,069,112 —
Shareholders' equity 1,344,092 1,188,431 13.1
Primary service units (“PSU”) growth(4) 5,546 73,645 (92.5)
Per Share Data(5)
Earnings per share
From continuing and discontinued operations
Basic 3.80 4.62 (17.7)
Diluted 3.78 4.60 (17.8)
From continuing operations
Basic 3.80 3.48 9.2
Diluted 3.78 3.46 9.2
From discontinued operations
Basic —1.14 —
Diluted —1.13 —
Weighted average number of multiple and subordinate voting shares outstanding 48,646,340 48,654,376 —
(1) The indicated terms do not have standardized definitions prescribed by IFRS and, therefore, may not be comparable to similar measures presented by other
companies. For more details, please consult the “Non-IFRS financial measures” section of the MD&A.
(2) Fiscal 2013 acquisitions of property, plant and equipment, intangible and other assets include assets acquired under finance lease of $0.9 million that are
excluded from the statements of cash flows.
(3) Indebtedness is defined as the aggregate of bank indebtedness, principal on long-term debt, balance due on a business combination and obligations under
derivative financial instruments.
(4) Represents the sum of Television, High Speed Internet (“HSI”) and Telephony service customers.
(5) Per multiple and subordinate voting share.