Chesapeake Energy 2011 Annual Report Download - page 10
Download and view the complete annual report
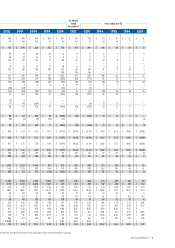
Please find page 10 of the 2011 Chesapeake Energy annual report below. You can navigate through the pages in the report by either clicking on the pages listed below, or by using the keyword search tool below to find specific information within the annual report.-
 1
1 -
 2
2 -
 3
3 -
 4
4 -
 5
5 -
 6
6 -
 7
7 -
 8
8 -
 9
9 -
 10
10 -
 11
11 -
 12
12 -
 13
13 -
 14
14 -
 15
15 -
 16
16 -
 17
17 -
 18
18 -
 19
19 -
 20
20 -
 21
21 -
22
-
23
-
24
-
25
-
26
-
27
-
28
-
29
-
30
-
31
-
32
-
33
-
34
-
35
-
36
-
37
-
38
-
39
-
40
-
41
-
42
-
43
-
44
-
45
-
46
-
47
-
48
-
49
-
50
-
51
-
52
 |
 |

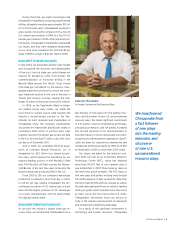
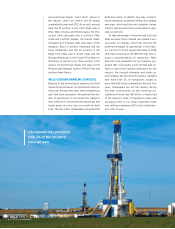
Chesapeake has produced
only 2% of the resource
base we own.
distinctive ability to identify new play concepts,
secure leasehold, accelerate drilling and validate
new plays, which would be very valuable to larger
industry partners who had not been able to repli-
cate our skill sets.
To take advantage of what we had built and
what we knew others needed, we created a very
successful JV strategy, which has become the
preferred template for partnership in the indus-
try. Our first JV in the Haynesville Shale in 2008
with Plains Exploration (NYSE:PXP) was the in-
dustry’s groundbreaking JV transaction. Many
observers and competitors of our company sug-
gested that it was likely a one-o deal and un-
likely to have much lasting significance for the
industry. We thought otherwise, and today our
bold strategy has become the industry standard
with more than 35 JV transactions valued at
more than $36 billion completed in the past four
years. Chesapeake has led the industry during
this time, closing seven JVs and receiving con-
sideration of more than $16 billion, or nearly half
of the industry’s total JV transaction value, and
recouping 120% of our initial investment while
only selling an average of 25% of our initial inter-
est in the JV plays.
8 | Letter to Shareholders
unconventional liquids “Land Rush” period in
the industry, which we believe will be largely
completed by year-end 2012. As a result, we now
have the #1 position in the Utica Shale play in
Ohio, West Virginia and Pennsylvania; the Mis-
sissippi Lime carbonate play in northern Okla-
homa and southern Kansas; the Granite Wash,
Cleveland and Tonkawa tight sand plays of the
Anadarko Basin in western Oklahoma and the
Texas Panhandle; and the #2 position in the
Eagle Ford Shale play in South Texas and the
Niobrara Shale play in the Powder River Basin in
Wyoming, as well as a top three position in the
various unconventional liquids-rich plays of the
Permian and Delaware basins of West Texas and
southern New Mexico.
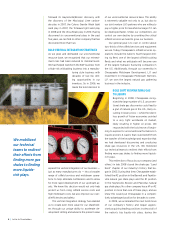
VALUE-CREATING FINANCING STRATEGIES
Because of the technological advances and bold
moves discussed above, our investment opportu-
nities over the past few years have exceeded our
cash flow from operations. We believed the win-
dow of opportunity to lock down the industry’s
best collection of unconventional natural gas and
liquids assets at a very low cost would be short
lived. We also knew Chesapeake possessed the