CenterPoint Energy 2014 Annual Report Download - page 11
Download and view the complete annual report
Please find page 11 of the 2014 CenterPoint Energy annual report below. You can navigate through the pages in the report by either clicking on the pages listed below, or by using the keyword search tool below to find specific information within the annual report.-
 1
1 -
 2
2 -
 3
3 -
 4
4 -
 5
5 -
 6
6 -
 7
7 -
 8
8 -
 9
9 -
 10
10 -
 11
11 -
 12
12 -
 13
13 -
 14
14 -
 15
15 -
 16
16 -
 17
17 -
 18
18 -
 19
19 -
 20
20 -
 21
21 -
 22
22 -
23
-
24
-
25
-
26
-
27
-
28
-
29
-
30
-
31
-
32
-
33
-
34
-
35
-
36
-
37
-
38
-
39
-
40
-
41
-
42
-
43
-
44
-
45
-
46
-
47
-
48
-
49
-
50
-
51
-
52
-
53
-
54
-
55
-
56
-
57
-
58
-
59
-
60
-
61
-
62
-
63
-
64
-
65
-
66
-
67
-
68
-
69
-
70
-
71
-
72
-
73
-
74
-
75
-
76
-
77
-
78
-
79
-
80
-
81
-
82
-
83
-
84
-
85
-
86
-
87
-
88
-
89
-
90
-
91
-
92
-
93
-
94
-
95
-
96
-
97
-
98
-
99
-
100
-
101
-
102
-
103
-
104
-
105
-
106
-
107
-
108
-
109
-
110
-
111
-
112
-
113
-
114
-
115
-
116
-
117
-
118
-
119
-
120
-
121
-
122
-
123
-
124
-
125
-
126
-
127
-
128
-
129
-
130
-
131
-
132
-
133
-
134
-
135
-
136
-
137
-
138
-
139
-
140
-
141
-
142
-
143
-
144
-
145
-
146
-
147
-
148
-
149
-
150
-
151
-
152
-
153
-
154
-
155
-
156
-
157
-
158
-
159
-
160
-
161
-
162
-
163
-
164
-
165
-
166
-
167
-
168
-
169
-
170
-
171
-
172
-
173
-
174
-
175
-
176
-
177
-
178
-
179
-
180
-
181
-
182
-
183
-
184
-
185
-
186
-
187
-
188
-
189
-
190
-
191
-
192
-
193
-
194
-
195
-
196
-
197
 |
 |

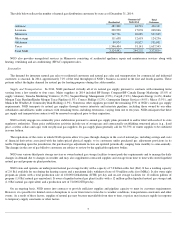
The table below reflects the number of natural gas distribution customers by state as of December 31, 2014:
NGD also provides unregulated services in Minnesota consisting of residential appliance repair and maintenance services along with
heating, ventilating and air conditioning (HVAC) equipment sales.
Seasonality
The demand for intrastate natural gas sales to residential customers and natural gas sales and transportation for commercial and industrial
customers is seasonal. In 2014, approximately 71% of the total throughput of NGD’
s business occurred in the first and fourth quarters. These
patterns reflect the higher demand for natural gas for heating purposes during the colder months.
Supply and Transportation.
In 2014, NGD purchased virtually all of its natural gas supply pursuant to contracts with remaining terms
varying from a few months to four years. Major suppliers in 2014 included BP Energy Company/BP Canada Energy Marketing (15.8% of
supply volumes), Tenaska Marketing Ventures (13.9%), Sequent Energy Management (9.0%), Cargill (7.4%), Macquarie Energy (6.4%), Kinder
Morgan Tejas Pipeline/Kinder Morgan Texas Pipeline (6.3%), Conoco Phillips (5.2%), Centerpoint Energy Services (4.9%), Mieco (3.5%), and
Munich Re Weather & Commodity Risk Holding (2.5%). Numerous other suppliers provided the remaining 25% of NGD’
s natural gas supply
requirements. NGD transports its natural gas supplies through various intrastate and interstate pipelines, including those owned by our other
subsidiaries and affiliates, under contracts with remaining terms, including extensions, varying from one to ten years. NGD anticipates that these
gas supply and transportation contracts will be renewed or replaced prior to their expiration.
NGD actively engages in commodity price stabilization pursuant to annual gas supply plans presented to and/or filed with each of its state
regulatory authorities. These price stabilization activities include use of storage gas and contractually establishing structured prices (e.g., fixed
price, costless collars and caps) with our physical gas suppliers. Its gas supply plans generally call for 50-
75% of winter supplies to be stabilized
in some fashion.
The regulations of the states in which NGD operates allow it to pass through changes in the cost of natural gas, including savings and costs
of financial derivatives associated with the index-
priced physical supply, to its customers under purchased gas adjustment provisions in its
tariffs. Depending upon the jurisdiction, the purchased gas adjustment factors are updated periodically, ranging from monthly to semi-
annually.
The changes in the cost of gas billed to customers are subject to review by the applicable regulatory bodies.
NGD uses various third-party storage services or owned natural gas storage facilities to meet peak-
day requirements and to manage the daily
changes in demand due to changes in weather and may also supplement contracted supplies and storage from time to time with stored liquefied
natural gas and propane-air plant production.
NGD owns and operates an underground natural gas storage facility with a capacity of 7.0 billion cubic feet (Bcf). It has a working capacity
of 2.0 Bcf available for use during the heating season and a maximum daily withdrawal rate of 50 million cubic feet (MMcf). It also owns eight
propane-air plants with a total production rate of 180,000 Dekatherms (DTH) per day and on-
site storage facilities for 12 million gallons of
propane (1.0 Bcf natural gas equivalent). It owns a liquefied natural gas plant facility with a 12 million-
gallon liquefied natural gas storage tank
(1.0 Bcf natural gas equivalent) and a production rate of 72,000 DTH per day.
On an ongoing basis, NGD enters into contracts to provide sufficient supplies and pipeline capacity to meet its customer requirements.
However, it is possible for limited service disruptions to occur from time to time due to weather conditions, transportation constraints and other
events. As a result of these factors, supplies of natural gas may become unavailable from time to time, or prices may increase rapidly in response
to temporary supply constraints or other factors.
5
Residential
Commercial/
Industrial
Total
Customers
Arkansas
381,800
48,521
430,321
Louisiana
230,990
17,076
248,066
Minnesota
762,736
69,089
831,825
Mississippi
111,638
12,618
124,256
Oklahoma
90,974
10,827
101,801
Texas
1,546,404
91,141
1,637,545
Total NGD
3,124,542
249,272
3,373,814