Cemex 1997 Annual Report Download - page 7
Download and view the complete annual report
Please find page 7 of the 1997 Cemex annual report below. You can navigate through the pages in the report by either clicking on the pages listed below, or by using the keyword search tool below to find specific information within the annual report.-
 1
1 -
 2
2 -
 3
3 -
 4
4 -
 5
5 -
 6
6 -
 7
7 -
 8
8 -
 9
9 -
 10
10 -
 11
11 -
 12
12 -
 13
13 -
 14
14 -
 15
15 -
 16
16 -
 17
17 -
 18
18 -
19
-
20
-
21
-
22
-
23
-
24
-
25
-
26
-
27
-
28
-
29
-
30
-
31
-
32
-
33
-
34
-
35
-
36
-
37
-
38
-
39
-
40
-
41
-
42
-
43
-
44
-
45
-
46
-
47
-
48
-
49
-
50
-
51
-
52
-
53
-
54
-
55
-
56
-
57
-
58
-
59
-
60
-
61
-
62
-
63
-
64
-
65
-
66
-
67
-
68
-
69
-
70
-
71
-
72
-
73
-
74
-
75
-
76
-
77
-
78
-
79
-
80
 |
 |

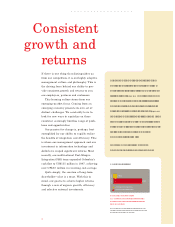
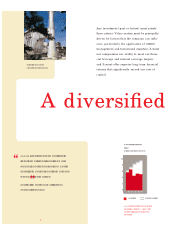
Consolidated
net sales*
CEMEXÕ top-line results
demonstrate the success
of its geographic diversi-
fication strategy. The
sales gain resulting from
strong performance in
the companyÕs core busi-
nesses allowed CEMEX to
continue its growth
strategy while leaving
excess cash to strengthen
its capital structure.
*Pesos based on: 1,284 million shares for 1997 and 1,298 million shares for 1996.
(See footnote N¼ 18 to Financial Statements).
**Pesos based on: 1,268 million shares for 1997 and 1,303 million shares for 1996.
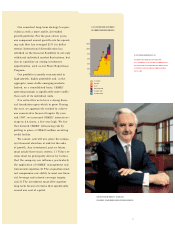
Consolidated
operating cash flow* Total assets*
CEMEX’net sales
surge
8.2%
FINANCIAL HIGHLIGHTS
*Millions of constant pesos (DEC97)
CEMEX, S.A. DE C.V. AND SUBSIDIARIES
THOUSANDS OF CONSTANT PESOS %
AS OF DECEMBER 31, 1997 1997 1996 change
Consolidated Net Sales 30,573,187 28,249,204 8.2
Gross Profit 11,838,187 11,119,823 6.5
Operating Profit 7,224,402 6,733,976 7.3
Consolidated Net Income 7,000,551 9,199,720 (23.9)
Net Income, Majority Interest 6,139,959 8,201,755 (25.1)
Total Assets 82,567,726 83,457,280 (1.1)
Total Liabilities 44,668,852 47,052,048 (5.1)
Stockholders’ Equity 37,898,874 36,405,232 4.1
Current Assets/Current Liabilities 1.21 1.11 N.A.
Total Liabilities/Stockholders’ Equity 1.18 1.29 N.A.
Operating Cash Flow per Share* 7.500 7.000 7.1
Net Income per Ordinary Share* 4.780 6.320 (24.4)
Book Value per Ordinary Share** 22.360 21.490 4.0
5
7,537
8,599
8887 89 90 91 92 93 94 95 96 97
11,756
12,235
14,085
16,496
20,451
22,007
26,965
28,249
30,573
8887 89 90 91 92 93 94 95 96 97
2,156
2,939
2,105
3,041
4,678
5,259
6,454
7,528
8,573
9,127
9,631