Cash America 2004 Annual Report Download - page 9
Download and view the complete annual report
Please find page 9 of the 2004 Cash America annual report below. You can navigate through the pages in the report by either clicking on the pages listed below, or by using the keyword search tool below to find specific information within the annual report.-
 1
1 -
 2
2 -
 3
3 -
 4
4 -
 5
5 -
 6
6 -
 7
7 -
 8
8 -
 9
9 -
 10
10
 |
 |

20 Years of Growth
2
0
Y
e
a
r
s
o
f
I
n
n
o
v
a
t
i
o
n
2
0
Y
e
a
r
s
o
f
L
e
a
d
e
r
s
h
i
p
2
0
Y
e
a
r
s
o
f
S
e
r
v
i
c
e
2
0
Y
e
a
r
s
o
f
A
d
v
a
n
c
e
s
2
0
Y
e
a
r
s
o
f
T
e
c
h
n
o
l
o
g
y
2
0
Y
e
a
r
s
o
f
G
r
o
w
t
h
2
0
Y
e
a
r
s
o
f
I
n
n
o
v
a
t
i
o
n
2
0
Y
e
a
rs
o
f
L
e
a
d
e
r
s
h
i
p
2
0
Y
e
a
r
s
o
f
S
e
r
v
i
c
e
2
0
Y
e
a
r
s
o
f
A
d
v
a
n
c
e
s
2
0
Y
e
a
r
s
o
f
T
e
c
h
n
o
l
o
g
y
2
0
Y
e
a
r
s
o
f
G
r
o
w
t
h
2
0
14 15
Abilene
Austin
CorpusChristi
Dallas/Ft.Worth
ElPaso
Houston
Laredo
Odessa/Midland
SanAntonio
Waco
Tyler
Lubbock
McAllen/Brownsville
Birmingham
NewOrleans
Mobile
BatonRouge
Tulsa
OklahomaCity
Monroe
Memphis
KansasCity
St.Louis
Denver
ColoradoSprings
Pueblo
Omaha
Chicago
Nashville
FortWayne
Indianapolis
Greensboro
WinstonSalem
Charlotte
Atlanta
Greenville
Charleston
Savannah
Jacksonville
DaytonaBeach
Tampa/
St.Petersburg
WestPalmBeach
Ft.Lauderdale
Miami
Seattle
LasVegas
Reno
CarsonCity SaltLakeCity
Phoenix
Scottsdale
Mesa
SantaMaria
LosAngeles
SantaBarbara
SanDiego
Louisville
Lansing
Detroit
Cleveland
Cinncinati
Canton
Columbus
Toledo Akron
Dayton
Lexington
BowlingGreen
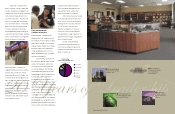
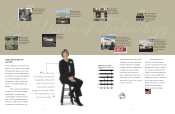
Mr.Payrollkiosksaddanother
levelofcustomerservice.
Currently,thereare134franchised
andCompany-ownedMr.Payroll
locationsin20states.Ourcustomers
usetheservicetocashchecksandto
purchasemoneyordersineasy-to-use
kiosks,locatedmostlyinconvenience
stores.Thissymbioticrelationship
offersstoreownersawaytobringin
morecustomerswithcashinhand,
andgivesCashAmericatheopportu-
nitytoofferevengreaterconvenience
toourcustomers.
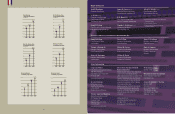
LENDINGLOCATIONSAsofDecember31
PAWN 2004 2003 2002
Texas 174 173 171
Florida 64 63 62
Nevada 26 – –
Tennessee 23 25 27
Louisiana 20 20 20
Georgia 17 17 19
Missouri 16 16 16
Arizona 15 – –
Oklahoma 15 15 15
Indiana 13 13 13
Illinois 11 10 12
NorthCarolina 10 10 10
Alabama 9 9 9
Kentucky 9 9 9
Utah 7 7 6
SouthCarolina 6 6 6
Ohio 6 6 6
Colorado 5 5 5
Washington 4 – –
California 1 – –
Nebraska 1 1 1
Kansas – – 2
TotalPawn 452 405 409
CASHADVANCE
Ohio 134 127 –
Texas 46 19 2
California 32 – –
Kentucky 17 8 –
Indiana 15 – –
Michigan 9 – –
TotalCashAdvance 253 154 2
TotalLendingLocations 705 559 411
2001
Lending Assets per Pawn
Location at December 31
(in thousands)
2002 2003 2004
Pawn Loans Cash Advances
$18
$31 $35
$43
$190 $199 $204
$248
2001
Total Lending Locations
at December 31
2002 2003 2004
800
700
600
500
400
300
200
100
0
417 411
559
705
$290
$280
$260
$240
$220
$200
$180
$160
$140