Carnival Cruises 2009 Annual Report Download - page 6
Download and view the complete annual report
Please find page 6 of the 2009 Carnival Cruises annual report below. You can navigate through the pages in the report by either clicking on the pages listed below, or by using the keyword search tool below to find specific information within the annual report.-
 1
1 -
 2
2 -
 3
3 -
 4
4 -
 5
5 -
 6
6 -
 7
7 -
 8
8 -
 9
9 -
 10
10 -
 11
11 -
 12
12 -
 13
13 -
 14
14 -
 15
15 -
 16
16 -
 17
17 -
18
-
19
-
20
-
21
-
22
-
23
-
24
-
25
-
26
-
27
-
28
-
29
-
30
-
31
-
32
-
33
-
34
-
35
-
36
-
37
-
38
-
39
-
40
-
41
-
42
-
43
-
44
-
45
-
46
-
47
-
48
-
49
-
50
-
51
-
52
-
53
-
54
-
55
-
56
-
57
-
58
-
59
 |
 |

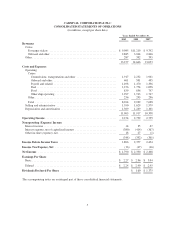
CARNIVAL CORPORATION & PLC
CONSOLIDATED STATEMENTS OF OPERATIONS
(in millions, except per share data)
Years Ended November 30,
2009 2008 2007
Revenues
Cruise
Passenger tickets ............................................... $ 9,985 $11,210 $ 9,792
Onboard and other .............................................. 2,885 3,044 2,846
Other ........................................................... 287 392 395
13,157 14,646 13,033
Costs and Expenses
Operating
Cruise
Commissions, transportation and other ............................ 1,917 2,232 1,941
Onboard and other ............................................ 461 501 495
Payroll and related ............................................ 1,498 1,470 1,336
Fuel ........................................................ 1,156 1,774 1,096
Food ....................................................... 839 856 747
Other ship operating ........................................... 1,997 1,913 1,717
Other ......................................................... 236 293 296
Total ......................................................... 8,104 9,039 7,628
Selling and administrative .......................................... 1,590 1,629 1,579
Depreciation and amortization ....................................... 1,309 1,249 1,101
11,003 11,917 10,308
Operating Income .................................................. 2,154 2,729 2,725
Nonoperating (Expense) Income
Interest income ................................................... 14 35 67
Interest expense, net of capitalized interest ............................. (380) (414) (367)
Other income (expense), net ......................................... 18 27 (1)
(348) (352) (301)
Income Before Income Taxes ........................................ 1,806 2,377 2,424
Income Tax Expense, Net ........................................... (16) (47) (16)
Net Income ....................................................... $ 1,790 $ 2,330 $ 2,408
Earnings Per Share
Basic ........................................................... $ 2.27 $ 2.96 $ 3.04
Diluted ......................................................... $ 2.24 $ 2.90 $ 2.95
Dividends Declared Per Share ....................................... $ 1.60 $ 1.375
The accompanying notes are an integral part of these consolidated financial statements.
5