Cardinal Health 2015 Annual Report Download - page 10
Download and view the complete annual report
Please find page 10 of the 2015 Cardinal Health annual report below. You can navigate through the pages in the report by either clicking on the pages listed below, or by using the keyword search tool below to find specific information within the annual report.-
 1
1 -
 2
2 -
 3
3 -
 4
4 -
 5
5 -
 6
6 -
 7
7 -
 8
8 -
 9
9 -
 10
10 -
 11
11 -
 12
12 -
 13
13 -
 14
14 -
 15
15 -
 16
16 -
 17
17 -
 18
18 -
 19
19 -
 20
20 -
 21
21 -
22
-
23
-
24
-
25
-
26
-
27
-
28
-
29
-
30
-
31
-
32
-
33
-
34
-
35
-
36
-
37
-
38
-
39
-
40
-
41
-
42
-
43
-
44
-
45
-
46
-
47
-
48
-
49
-
50
-
51
-
52
-
53
-
54
-
55
-
56
-
57
-
58
-
59
-
60
-
61
-
62
-
63
-
64
-
65
-
66
-
67
-
68
-
69
-
70
-
71
-
72
-
73
-
74
-
75
-
76
-
77
-
78
-
79
-
80
-
81
-
82
-
83
-
84
-
85
-
86
-
87
-
88
-
89
-
90
-
91
 |
 |

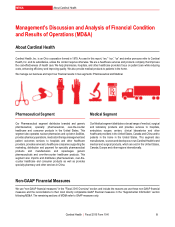
MD&A Results of Operations
9Cardinal Health | Fiscal 2015 Form 10-K
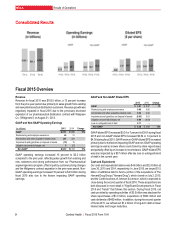
Consolidated Results
Fiscal 2015 Overview
Revenue
Revenue for fiscal 2015 was $102.5 billion, a 13 percent increase
from the prior-year period due primarily to sales growth from existing
and new pharmaceutical distribution customers. Revenue growth was
negatively impacted in fiscal 2015 due to the previously disclosed
expiration of our pharmaceutical distribution contract with Walgreen
Co. ("Walgreens") on August 31, 2013.
GAAP and Non-GAAP Operating Earnings
(in millions) 2015 2014 Change
GAAP $2,161 $1,885 15%
Restructuring and employee severance 44 31
Amortization and other acquisition-related costs 281 223
Impairments and (gain)/loss on disposal of assets (19) 15
Litigation (recoveries)/charges, net 5(21)
Non-GAAP $2,472 $2,133 16%
GAAP operating earnings increased 15 percent to $2.2 billion
compared to the prior year, reflecting sales growth from existing and
new customers and strong performance from our Pharmaceutical
segment generics program, offset in part by customer pricing changes
and the Walgreens contract expiration in the prior-year period. Non-
GAAP operating earnings increased 16 percent to $2.5 billion during
fiscal 2015 also due to the factors impacting GAAP operating
earnings.
GAAP and Non-GAAP Diluted EPS
2015 2014 Change
GAAP $ 3.61 $ 3.37 7%
Restructuring and employee severance 0.09 0.06
Amortization and other acquisition-related costs 0.54 0.42
Impairments and (gain)/loss on disposal of assets (0.03) 0.03
Litigation (recoveries)/charges, net 0.06 (0.04)
Loss on extinguishment of debt 0.11 —
Non-GAAP $ 4.38 $ 3.84 14%
GAAP diluted EPS increased $0.24 or 7 percent to $3.61 during fiscal
2015 and non-GAAP diluted EPS increased $0.54 or 14 percent to
$4.38 during fiscal 2015. GAAP and non-GAAP diluted EPS increased
primarily due to the factors impacting GAAP and non-GAAP operating
earnings as well as a lower share count driven by share repurchases
and partially offset by an increase in income taxes. GAAP diluted EPS
was also impacted by a $37 million after-tax loss on extinguishment
of debt in the current year.
Cash and Equivalents
Our cash and equivalents balance was $4.6 billion and $2.9 billion at
June 30, 2015 and 2014, respectively. In June 2015, we issued $1.5
billion of additional debt to fund a portion of the acquisitions of The
Harvard Drug Group ("Harvard Drug"), which closed on July 2, 2015,
and the Cordis business of Johnson & Johnson, which is expected to
close during the second quarter of fiscal 2016. These acquisitions are
both discussed in more detail in "Significant Developments in Fiscal
2015 and Trends" that follows this section. During fiscal 2015, net
cash provided by operating activities of $2.5 billion was deployed for
share repurchases of $1.0 billion, acquisitions of $503 million and
cash dividends of $460 million. In addition, during the second quarter
of fiscal 2015, we refinanced $1.2 billion of long-term debt at lower
interest rates and longer maturities.