Boeing 2009 Annual Report Download - page 3
Download and view the complete annual report
Please find page 3 of the 2009 Boeing annual report below. You can navigate through the pages in the report by either clicking on the pages listed below, or by using the keyword search tool below to find specific information within the annual report.-
 1
1 -
 2
2 -
 3
3 -
 4
4 -
 5
5 -
 6
6 -
 7
7 -
 8
8 -
 9
9 -
 10
10 -
 11
11 -
 12
12 -
 13
13 -
 14
14 -
15
-
16
-
17
-
18
-
19
-
20
-
21
-
22
-
23
-
24
-
25
-
26
-
27
-
28
-
29
-
30
-
31
-
32
-
33
-
34
-
35
-
36
-
37
-
38
-
39
-
40
-
41
-
42
-
43
-
44
-
45
-
46
-
47
-
48
-
49
-
50
-
51
-
52
-
53
-
54
-
55
-
56
-
57
-
58
-
59
-
60
-
61
-
62
-
63
-
64
-
65
-
66
-
67
-
68
-
69
-
70
-
71
-
72
-
73
-
74
-
75
-
76
-
77
-
78
-
79
-
80
-
81
-
82
-
83
-
84
-
85
-
86
-
87
-
88
-
89
-
90
-
91
-
92
-
93
-
94
-
95
-
96
-
97
-
98
-
99
-
100
-
101
-
102
-
103
-
104
-
105
-
106
-
107
-
108
-
109
-
110
-
111
-
112
-
113
-
114
-
115
-
116
-
117
-
118
-
119
-
120
-
121
-
122
-
123
-
124
-
125
-
126
-
127
-
128
-
129
-
130
-
131
-
132
-
133
-
134
-
135
-
136
-
137
-
138
-
139
-
140
-
141
-
142
-
143
-
144
-
145
-
146
-
147
-
148
-
149
-
150
-
151
-
152
-
153
-
154
-
155
-
156
-
157
-
158
-
159
-
160
 |
 |

1
– Delivered record revenue of $68.3
billion — up 12 percent from 2008 — on
higher commercial deliveries and growth
in our defense, space and security
business.
– Earned $1.87 per share, down from
$3.65 a share, due principally to the
reclassifi cation of certain 787 costs, the
impact of diffi cult market conditions and
increased development costs for the
747-8 program.
– Maintained a total backlog of
$316 billion — more than four times
current annual revenue.
– Generated strong operating cash fl ow
of $5.6 billion for the year, refl ecting
disciplined operational and working
capital management across Boeing.
– Delivered 481 commercial airplanes,
including the most-ever 737 and 777
deliveries in a given year, and captured
263 gross orders.
– Delivered 121 production military
aircraft and six satellites.
– Captured new Boeing Defense, Space
& Security business, including an Intelsat
satellite contract; key proprietary and
services contracts; and international
sales of eight P-8I long-range maritime
reconnaissance and anti-submarine
warfare aircraft to India, 15 Chinooks to
Canada and 16 to Italy, and six C-17s to
the United Arab Emirates.
Operational SummaryOperational Summary
– Achieved critical Boeing Commercial
Airplanes milestones with fi rst fl ight of the
787 Dreamliner, delivery of the fi rst 777
Freighter, delivery of the 6,000th 737 and
breaking ground on a 787 fi nal assembly
facility in North Charleston, South Carolina.
– Met key Defense, Space & Security
milestones, including approval of full-rate
production for the EA-18G, fi rst fl ight of
the P-8A Poseidon, delivery of the fi rst of
24 F/A-18F Super Hornets for the Royal
Australian Air Force, approval of low-
rate production for Increment One of the
Brigade Combat Team Modernization
program (formerly Future Combat Systems)
and 100-percent mission success on
21 space shuttle and satellite launches.
– Extended our environmental leadership
in many areas, including conducting
sustainable biofuel demonstration fl ights;
earning recognition from the investor-led
Carbon Disclosure Project as the top-
performing industrial company in climate-
change disclosure; receiving Smart Grid
grants from the U.S. Department of
Energy; and piloting programs to deliver
military and commercial airplanes painted
with chrome-free primer.
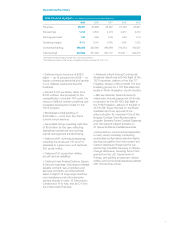
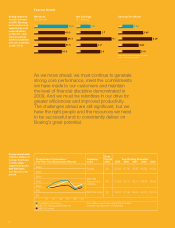
2009 2008 2007 2006 2005
Revenues 68,281 60,909 66,387 61,530 53,621
Net earnings 1,312 2,672 4,074 2,215 2,572
Earnings per share* 1.87 3.65 5.26 2.84 3.19
Operating margins 3.1% 6.5% 8.8% 4.9% 5.2%
Contractual backlog 296,500 323,860 296,964 216,563 160,637
Total backlog† 315,558 351,926 327,137 250,211 205,215
2009 Financial Highlights U.S. dollars in millions except per share data
* Represents diluted earnings per share from continuing operations
†Total backlog includes contractual and unobligated backlog. See page 20 of the 10-K.