Big Lots 2011 Annual Report Download - page 2
Download and view the complete annual report
Please find page 2 of the 2011 Big Lots annual report below. You can navigate through the pages in the report by either clicking on the pages listed below, or by using the keyword search tool below to find specific information within the annual report.-
 1
1 -
 2
2 -
 3
3 -
 4
4 -
 5
5 -
 6
6 -
 7
7 -
 8
8 -
 9
9 -
 10
10 -
 11
11 -
 12
12 -
 13
13 -
14
-
15
-
16
-
17
-
18
-
19
-
20
-
21
-
22
-
23
-
24
-
25
-
26
-
27
-
28
-
29
-
30
-
31
-
32
-
33
-
34
-
35
-
36
-
37
-
38
-
39
-
40
-
41
-
42
-
43
-
44
-
45
-
46
-
47
-
48
-
49
-
50
-
51
-
52
-
53
-
54
-
55
-
56
-
57
-
58
-
59
-
60
-
61
-
62
-
63
-
64
-
65
-
66
-
67
-
68
-
69
-
70
-
71
-
72
-
73
-
74
-
75
-
76
-
77
-
78
-
79
-
80
-
81
-
82
-
83
-
84
-
85
-
86
-
87
-
88
-
89
-
90
-
91
-
92
-
93
-
94
-
95
-
96
-
97
-
98
-
99
-
100
-
101
-
102
-
103
-
104
-
105
-
106
-
107
-
108
-
109
-
110
-
111
-
112
-
113
-
114
-
115
-
116
-
117
-
118
-
119
-
120
-
121
-
122
-
123
-
124
-
125
-
126
-
127
-
128
-
129
-
130
-
131
-
132
-
133
-
134
-
135
-
136
-
137
-
138
-
139
-
140
-
141
-
142
-
143
-
144
-
145
-
146
-
147
-
148
-
149
-
150
-
151
-
152
-
153
-
154
-
155
-
156
-
157
-
158
-
159
-
160
-
161
-
162
-
163
-
164
-
165
-
166
-
167
-
168
-
169
-
170
-
171
-
172
-
173
-
174
-
175
-
176
-
177
-
178
-
179
-
180
-
181
-
182
-
183
-
184
-
185
-
186
-
187
-
188
-
189
-
190
-
191
-
192
-
193
-
194
-
195
-
196
-
197
-
198
-
199
-
200
-
201
-
202
-
203
-
204
-
205
-
206
-
207
 |
 |

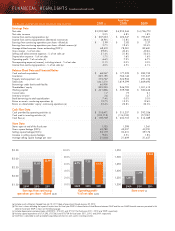
Earnings Data
Net sales $ 5,202,269 $ 4,952,244 $ 4,726,772
Net sales increase 5.0% 4.8% 1.8%
Income from continuing operations (b) $ 207,235 $ 222,547 $ 195,627
Income from continuing operations (decrease) increase (b) (6.9)% 13.8% 26.4%
Earnings from continuing operations per share - diluted (b) $ 2.99 $ 2.83 $ 2.37
Earnings from continuing operations per share - diluted increase (b) 5.7% 19.4% 25.4%
Average diluted common shares outstanding (000's) 69,419 78,581 82,681
Gross margin - % of net sales 39.8% 40.6% 40.6%
Selling and administrative expenses - % of net sales (b) 31.4% 31.8% 32.3%
Depreciation expense - % of net sales 1.7% 1.6% 1.6%
Operating profit - % of net sales (b) 6.6% 7.2% 6.7%
Non-operating expense (income), including interest - % of net sales 0.1% 0.0% 0.0%
Income from continuing operations - % of net sales (b) 4.0% 4.5% 4.1%
Balance Sheet Data and Financial Ratios
Cash and cash equivalents $ 68,547 $ 177,539 $ 283,733
Inventories 825,195 762,146 731,337
Property and equipment - net 572,767 524,906 491,256
Total assets 1,641,310 1,619,599 1,669,493
Borrowings under bank credit facility 65,900 – –
Shareholders’ equity 823,233 946,793 1,001,412
Working capital $ 421,836 $ 509,788 $ 580,446
Current ratio 1.7 1.9 2.1
Inventory turnover 3.6 3.6 3.7
Bank borrowings to total capitalization 7.4% 0.0% 0.0%
Return on assets - continuing operations (b) 12.7% 13.5% 12.6%
Return on shareholders’ equity - continuing operations (b) 23.4% 22.8% 22.0%
Cash Flow Data
Cash provided by operating activities (c) $ 318,471 $ 315,257 $ 392,026
Cash used in investing activities (d) (120,712) (114,552) (77,937)
Cash flow (e) $ 197,759 $ 200,705 $ 314,089
Store Data
Stores open at end of the fiscal year 1,533 1,398 1,361
Gross square footage (000’s) 45,780 42,037 40,591
Selling square footage (000’s) 33,119 30,210 29,176
Increase in selling square footage 9.6% 3.5% 1.8%
Average selling square footage per store 21,604 21,609 21,437
FINANCIAL HIGHLIGHTS (Unaudited Adjusted Results)
($ in thousands, except per share amounts and sales per selling square foot) 2 011 ( a ) 2 010 2009
Fiscal Year
(a)
Includes results of Big Lots Canada from July 18, 2011 (date of acquisition) through January 28, 2012.
(b)
This item is shown excluding the impact of certain items for fiscal year 2009. A reconciliation of the difference between GAAP and the non-GAAP financial measures presented in this
table for fiscal year 2009 is shown on the following page.
(c)
Includes depreciation and amortization of $82,851, $74,041, and $71,501 for fiscal years 2011, 2010, and 2009, respectively.
(d)
Includes capital expenditures of $131,293, $107,563, and $78,708 for fiscal years 2011, 2010, and 2009, respectively.
(e)
Cash flow is calculated as cash provided by operating activities less cash used in investing activities.
$3.50
$3.00
$2.50
$2.00
$1.50 2009 2010
Earnings from continuing
operations per share - diluted (a) (b)
$2.83
$2.37
$2.99
2 011
1,550
1,500
1,450
1,400
1,350
1,300 2009 2010
Store count
(a)
1,398
1,361
1,533
2 011
10.0%
8.0%
6.0%
4.0%
2.0%
0.0% 2009 2010
Operating profit -
% of net sales (a) ( b)
7.2 %
6.7% 6.6%
2 011