Big Lots 2007 Annual Report Download - page 3
Download and view the complete annual report
Please find page 3 of the 2007 Big Lots annual report below. You can navigate through the pages in the report by either clicking on the pages listed below, or by using the keyword search tool below to find specific information within the annual report.-
 1
1 -
 2
2 -
 3
3 -
 4
4 -
 5
5 -
 6
6 -
 7
7 -
 8
8 -
 9
9 -
 10
10 -
 11
11 -
 12
12 -
 13
13 -
 14
14 -
15
-
16
-
17
-
18
-
19
-
20
-
21
-
22
-
23
-
24
-
25
-
26
-
27
-
28
-
29
-
30
-
31
-
32
-
33
-
34
-
35
-
36
-
37
-
38
-
39
-
40
-
41
-
42
-
43
-
44
-
45
-
46
-
47
-
48
-
49
-
50
-
51
-
52
-
53
-
54
-
55
-
56
-
57
-
58
-
59
-
60
-
61
-
62
-
63
-
64
-
65
-
66
-
67
-
68
-
69
-
70
-
71
-
72
-
73
-
74
-
75
-
76
-
77
-
78
-
79
-
80
-
81
-
82
-
83
-
84
-
85
-
86
-
87
-
88
-
89
-
90
-
91
-
92
-
93
-
94
-
95
-
96
-
97
-
98
-
99
-
100
-
101
-
102
-
103
-
104
-
105
-
106
-
107
-
108
-
109
-
110
-
111
-
112
-
113
-
114
-
115
-
116
-
117
-
118
-
119
-
120
-
121
-
122
-
123
-
124
-
125
-
126
-
127
-
128
-
129
-
130
-
131
-
132
-
133
-
134
-
135
-
136
-
137
-
138
-
139
-
140
-
141
-
142
-
143
-
144
-
145
-
146
-
147
-
148
-
149
-
150
-
151
-
152
-
153
-
154
-
155
-
156
-
157
-
158
-
159
-
160
-
161
-
162
-
163
-
164
-
165
-
166
-
167
-
168
-
169
-
170
-
171
-
172
-
173
-
174
-
175
-
176
-
177
-
178
-
179
-
180
 |
 |

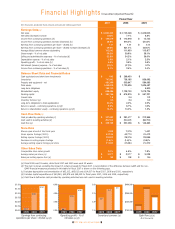
Financial Highlights(Unaudited Adjusted Results)
The Unaudited Adjusted Results, which include fi nancial measures that are not calculated in accordance with accounting
principles generally accepted in the United States of America (“GAAP”), are presented in order to improve comparability of
fi nancial information for the period presented. The Unaudited Adjusted Results should not be construed as an alternative to
the reported results determined in accordance with GAAP. Our defi nition of adjusted results may differ from similarly titled
measures used by other companies. While it is not possible to predict future results, our management believes that the
adjusted non-GAAP information is useful for the assessment of our ongoing operations. The Unaudited Adjusted Results should
be read in conjunction with our Consolidated Financial Statements and the related Notes contained in our 2007 Form 10-K.
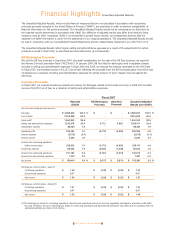
The Unaudited Adjusted Results refl ect higher selling and administrative expenses as a result of the adjustment for certain
proceeds received in fi scal 2007, as described and reconciled below ($ in thousands):
KB Bankruptcy Proceeds
We sold the KB Toys business in December 2000. As partial consideration for the sale of the KB Toys business, we received
the Havens Corners Corporation Note (“HCC Note”). In January 2004, KB Toys fi led for bankruptcy and in separate charges
included in selling and administrative expenses in fi scal 2003 and 2005, we reduced the balance receivable on the HCC Note.
In fi scal 2007, we recorded income of $3,127 (net of tax) refl ecting the proceeds from the KB Toys bankruptcy trust which was
recognized as a reduction of selling and administrative expenses for partial recovery of prior charges incurred against the
HCC Note.
Insurance Proceeds
In fi scal 2007, we received insurance proceeds as recovery for damages related to hurricanes occurring in 2005 and recorded
income of $2,974 (net of tax) as a reduction of selling and administrative expenses.
(f) The earnings per share for continuing operations, discontinued operations and net income are separately calculated in accordance with SFAS
No. 128; therefore, the sum of earnings per share for continuing operations and discontinued operations may differ, due to rounding, from the
calculated earnings per share of net income.
Fiscal 2007
($ in thousands, except per share amounts)
Net sales
$ 4,656,302 100.0 % $ - $ - $ 4,656,302 100.0 %
Cost of sales
2,815,959 60.5 - - 2,815,959 60.5
Gross profi t
1,840,343 39.5 - - 1,840,343 39.5
Selling and administrative expenses
1,515,379 32.5 5,172 4,920 1,525,471 32.8
Depreciation expense
88,484 1.9 - - 88,484 1.9
Operating profi t
236,480 5.1 (5,172) (4,920) 226,388 4.9
Interest expense
(2,513) (0.1) - - (2,513) (0.1)
Interest income
5,236 0.1 - - 5,236 0.1
Income from continuing operations
before income taxes
239,203 5.1 (5,172) (4,920) 229,111 4.9
Income tax expense
88,023 1.9 (2,045) (1,946) 84,032 1.8
Income from continuing operations
151,180 3.2 (3,127) (2,974) 145,079 3.1
Income from discontinued operations
7,281 0.2 - - 7,281 0.2
Net income
$ 158,461 3.4 % $ (3,127) $ (2,974) $ 152,360 3.3 %
Earnings per common share - basic (f)
Continuing operations
$ 1.49 $ (0.03) $ (0.03) $ 1.43
Discontinued operations
0.07 - - 0.07
Net income
$ 1.56 $ (0.03) $ (0.03) $ 1.50
Earnings per common share - diluted (f)
Continuing operations
$ 1.47 $ (0.03) $ (0.03) $ 1.41
Discontinued operations
0.07 - - 0.07
Net income
$ 1.55 $ (0.03) $ (0.03) $ 1.49
Reported
(GAAP)
KB Bankruptcy
Proceeds
Insurance
Proceeds
Unaudited Adjusted
Results (non-GAAP)
2007 Big Lots Annual Report