Big Lots 2007 Annual Report Download - page 2
Download and view the complete annual report
Please find page 2 of the 2007 Big Lots annual report below. You can navigate through the pages in the report by either clicking on the pages listed below, or by using the keyword search tool below to find specific information within the annual report.-
 1
1 -
 2
2 -
 3
3 -
 4
4 -
 5
5 -
 6
6 -
 7
7 -
 8
8 -
 9
9 -
 10
10 -
 11
11 -
 12
12 -
 13
13 -
14
-
15
-
16
-
17
-
18
-
19
-
20
-
21
-
22
-
23
-
24
-
25
-
26
-
27
-
28
-
29
-
30
-
31
-
32
-
33
-
34
-
35
-
36
-
37
-
38
-
39
-
40
-
41
-
42
-
43
-
44
-
45
-
46
-
47
-
48
-
49
-
50
-
51
-
52
-
53
-
54
-
55
-
56
-
57
-
58
-
59
-
60
-
61
-
62
-
63
-
64
-
65
-
66
-
67
-
68
-
69
-
70
-
71
-
72
-
73
-
74
-
75
-
76
-
77
-
78
-
79
-
80
-
81
-
82
-
83
-
84
-
85
-
86
-
87
-
88
-
89
-
90
-
91
-
92
-
93
-
94
-
95
-
96
-
97
-
98
-
99
-
100
-
101
-
102
-
103
-
104
-
105
-
106
-
107
-
108
-
109
-
110
-
111
-
112
-
113
-
114
-
115
-
116
-
117
-
118
-
119
-
120
-
121
-
122
-
123
-
124
-
125
-
126
-
127
-
128
-
129
-
130
-
131
-
132
-
133
-
134
-
135
-
136
-
137
-
138
-
139
-
140
-
141
-
142
-
143
-
144
-
145
-
146
-
147
-
148
-
149
-
150
-
151
-
152
-
153
-
154
-
155
-
156
-
157
-
158
-
159
-
160
-
161
-
162
-
163
-
164
-
165
-
166
-
167
-
168
-
169
-
170
-
171
-
172
-
173
-
174
-
175
-
176
-
177
-
178
-
179
-
180
 |
 |

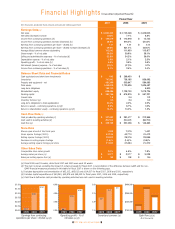
Fiscal Year
2007 2006 2005
($ in thousands, except per share amounts and sales per selling square foot)
Earnings Data
(a)
Net sales
$ 4,656,302 $ 4,743,048 $ 4,429,905
Net sales (decrease) increase
(1.8)% 7.1% 6.8%
Income from continuing operations (b)
$ 145,079 $ 112,618 $ 15,725
Income from continuing operations increase (decrease) (b)
28.8% 616.2% (50.0)%
Earnings from continuing operations per share - diluted (b)
$ 1.41 $ 1.01 $ 0.14
Earnings from continuing operations per share - diluted increase (decrease) (b)
39.6% 621.4% (48.1)%
Average diluted common shares outstanding
102,542 111,930 113,677
Gross margin - % of net sales
39.5% 39.9% 39.1%
Selling and administrative expenses - % of net sales (b)
32.8% 34.2% 36.0%
Depreciation expense - % of net sales
1.9% 2.1% 2.5%
Operating profi t - % of net sales (b)
4.9% 3.5% 0.6%
Net interest (income) expense - % of net sales
(0.1)% (0.1)% 0.1%
Income from continuing operations - % of net sales (b)
3.1% 2.4% 0.4%
Balance Sheet Data and Financial Ratios
Cash equivalents and short-term investments
$ 643 $ 269,430 $ -
Inventories
747,942 758,185 836,092
Property and equipment - net
481,366 505,647 584,083
Total assets
1,443,815 1,720,526 1,625,497
Long-term obligations
163,700 - 5,500
Shareholders’ equity
638,486 1,129,703 1,078,724
Working capital
$ 390,766 $ 674,815 $ 557,231
Current ratio
1.8 2.4 2.3
Inventory turnover (a)
3.5 3.4 3.0
Long-term obligations to total capitalization
20.4% 0.0% 0.5%
Return on assets - continuing operations (a) (b)
9.2% 6.7% 0.9%
Return on shareholders’ equity - continuing operations (a) (b)
16.4% 10.2% 1.5%
Cash Flow Data
(a)
Cash provided by operating activities (c)
$ 307,932 $ 381,477 $ 212,965
Cash used in investing activities (d)
(58,764) (30,421) (66,702)
Cash fl ow (e)
$ 249,168 $ 351,056 $ 146,263
Store Data
Stores open at end of the fi scal year
1,353 1,375 1,401
Gross square footage (000’s)
40,195 40,770 41,413
Selling square footage (000’s)
28,902 29,376 29,856
Decrease in selling square footage
(1.6)% (1.6)% (3.5)%
Average selling square footage per store
21,362 21,364 21,310
Other Sales Data
Comparable store sales growth
2.0% 4.6% 1.8%
Average sales per store (a)
$ 3,377 $ 3,377 $ 3,028
Sales per selling square foot (a)
$ 158 $ 158 $ 146
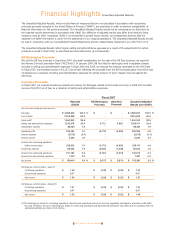
Financial Highlights(Unaudited Adjusted Results)
$1.50
$1.25
$1.00
$0.75
$0.50
$0.25
$0.00
Earnings from continuing
operations per share - diluted
(a) (b)
$1.01
6.0%
4.0%
2.0%
0.0%
Operating profi t - % of
net sales
(a) (b)
0.6%
3.5%
4.9%
(a) Fiscal 2006 was 53 weeks, while fi scal 2007 and 2005 were each 52 weeks.
(b) This item is shown excluding the impact of certain proceeds for fi scal 2007. A reconciliation of the difference between GAAP and the non-
GAAP fi nancial measures presented in this table for fi scal 2007 is shown on the following page.
(c) Includes depreciation and amortization of $83,103, $95,613 and $114,617 for fi scal 2007, 2006 and 2005, respectively.
(d) Includes capital expenditures of $60,360, $35,878 and $68,503 for fi scal years 2007, 2006 and 2005, respectively.
(e) Cash fl ow is defi ned as cash provided by operating activities less cash used in investing activities.
2005 2006 20072005 2006 2007
$0.14
$1.41
3.6
3.2
2.8
2.4
Inventory turnover
(a)
3.0
3.4
3.5
$400,000
$300,000
$200,000
$100,000
Cash fl ow
(a) (e)
($ in thousands)
$146,263
$351,056
$249,168
2005 2006 2007 2005 2006 2007 2005 2006 2007
2007 Big Lots Annual Report