Best Buy 2005 Annual Report Download - page 7
Download and view the complete annual report
Please find page 7 of the 2005 Best Buy annual report below. You can navigate through the pages in the report by either clicking on the pages listed below, or by using the keyword search tool below to find specific information within the annual report.-
 1
1 -
 2
2 -
 3
3 -
 4
4 -
 5
5 -
 6
6 -
 7
7 -
 8
8 -
 9
9 -
 10
10 -
 11
11 -
 12
12 -
 13
13 -
 14
14 -
 15
15 -
 16
16 -
 17
17 -
 18
18 -
19
-
20
-
21
-
22
-
23
-
24
-
25
-
26
-
27
-
28
-
29
-
30
-
31
-
32
-
33
-
34
-
35
-
36
-
37
-
38
-
39
-
40
-
41
-
42
-
43
-
44
-
45
-
46
-
47
-
48
-
49
-
50
-
51
-
52
-
53
-
54
-
55
-
56
-
57
-
58
-
59
-
60
-
61
-
62
-
63
-
64
-
65
-
66
-
67
-
68
-
69
-
70
-
71
-
72
-
73
-
74
-
75
-
76
-
77
-
78
-
79
-
80
-
81
-
82
-
83
-
84
-
85
-
86
-
87
-
88
-
89
-
90
-
91
-
92
-
93
-
94
-
95
-
96
-
97
-
98
-
99
-
100
-
101
-
102
-
103
-
104
-
105
-
106
-
107
-
108
-
109
-
110
-
111
-
112
-
113
-
114
-
115
-
116
-
117
-
118
 |
 |

Best Buy 05 Annual Report 3
gave the initiative momentum. Last year, we replicated and
built on their performance using a group of 67 segmented
stores. Customers clearly indicated through their purchases
that they preferred this new operating model.
Unleashing the Power of Our Employees
How is a customer-centric store different? The main
improvement is our approach to our employees. We expose
our employees to the customer segments that visit our stores
and train them to identify unmet needs. We encourage
employees to ask customers lifestyle questions and engage
in fresh dialog so that they can recommend suitable solutions.
Then we train employees to hypothesize, test and verify
new ways to meet specific needs of the local population.
We also build employees’ financial acumen, so they can
link new offerings with daily profit-and-loss statements.
They begin to act like owner/operators, and they can
more clearly envision a career at Best Buy. Ultimately, their
creativity and ingenuity become an engine for innovation
for our stores and for the company as a whole. I believe
that driving innovation deeper into the organization will
enable us to generate new growth platforms faster and
help sustain the company over the long term.
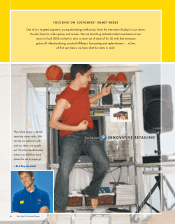
For example, upscale suburban moms have the resources
to purchase digital products and appreciate the many uses
of technology, but they aren’t always comfortable shopping
in our stores. In our labs, we added highly trained personal
shopping assistants (PSAs) who are available by appointment
and on a drop-in basis. While most employees work in
only one product area, PSAs help moms shop for themselves
and their families in all parts of our stores. When these moms
used a personal shopper, their average spending increased
dramatically. Moms also appreciated touches such as the
lower volumes of overhead music, race-car shopping carts
and well-signed restrooms.
Boosting Our Returns
Our culture is scorecard-driven, so we track a plethora of
financial and nonfinancial measures for customer centricity.
For example, these stores generally have had a comparable
store sales gain at least twice that of the rest of the chain.
They have a gross profit rate higher than that of the rest of
the chain. While the more highly trained employees and
start-up expenses result in a higher expense rate, these
stores have demonstrated the strong potential to expand
their overall profit contribution. In addition, our measures
of customer loyalty, market share and employee retention
are very encouraging.
We believe that the financial training, clearly defined
segments and daily reporting reduce the overall risk of
this endeavor. In fact, the primary constraints we face in
accelerating this strategy are our ability to attract and
retain the right talent, as well as the patience to allow
customer centricity stores the time to make the transition
and to achieve their profitability goals. Other challenges
are ongoing, such as the commoditization we face in
several product categories and issues related to vendors’
profitability which could affect their ability to invest in
product R&D over time.
FY 05FY 04FY 03
Diluted Earnings Per Share
(from continuing operations)
Fiscal 2005 diluted earnings per share from
continuing operations grew 16 percent,
reflecting revenue growth, increased efficiency,
higher net interest income and a lower effective
income tax rate.
$2.79
$2.41
$1.90
FY 05FY 04FY 03
Revenue
(U.S. dollars in millions)
Our fiscal 2005 revenue growth reflected the
opening of new stores and a comparable store
sales gain of 4.3 percent.
$27,433
$24,548
$20,943