Best Buy 2005 Annual Report Download - page 2
Download and view the complete annual report
Please find page 2 of the 2005 Best Buy annual report below. You can navigate through the pages in the report by either clicking on the pages listed below, or by using the keyword search tool below to find specific information within the annual report.-
 1
1 -
 2
2 -
 3
3 -
 4
4 -
 5
5 -
 6
6 -
 7
7 -
 8
8 -
 9
9 -
 10
10 -
 11
11 -
 12
12 -
 13
13 -
14
-
15
-
16
-
17
-
18
-
19
-
20
-
21
-
22
-
23
-
24
-
25
-
26
-
27
-
28
-
29
-
30
-
31
-
32
-
33
-
34
-
35
-
36
-
37
-
38
-
39
-
40
-
41
-
42
-
43
-
44
-
45
-
46
-
47
-
48
-
49
-
50
-
51
-
52
-
53
-
54
-
55
-
56
-
57
-
58
-
59
-
60
-
61
-
62
-
63
-
64
-
65
-
66
-
67
-
68
-
69
-
70
-
71
-
72
-
73
-
74
-
75
-
76
-
77
-
78
-
79
-
80
-
81
-
82
-
83
-
84
-
85
-
86
-
87
-
88
-
89
-
90
-
91
-
92
-
93
-
94
-
95
-
96
-
97
-
98
-
99
-
100
-
101
-
102
-
103
-
104
-
105
-
106
-
107
-
108
-
109
-
110
-
111
-
112
-
113
-
114
-
115
-
116
-
117
-
118
 |
 |

Best Buy FINANCIAL HIGHLIGHTS
Best Buy 05 Annual Report
(U.S. dollars in millions, except per share and per retail square foot amounts) Fiscal 2005 Fiscal 2004 Fiscal 2003
Revenue $27,433 $24,548 $20,943
Comparable store sales gain 4.3% 7.1% 2.4%
Gross profit rate 23.7% 23.9% 23.6%
SG&A rate 18.4% 18.6% 18.8%
Operating income rate 5.3% 5.3% 4.8%
Earnings from continuing operations $ 934 $ 800 $ 622
Net earnings $ 984 $ 705 $ 99
Diluted earnings per share – continuing operations(1) $ 2.79 $ 2.41 $ 1.90
Diluted earnings per share(1) $ 2.94 $ 2.13 $ 0.31
Cash and short-term investments $ 3,348 $ 2,600 $ 1,914
Debt-to-capitalization ratio(2) 12% 20% 23%
Cash dividends per share declared and paid $ 0.42 $ 0.40 –
Value of common shares repurchased $ 200 $ 100 –
Total retail square footage (in thousands) (3) 31,593 29,439 26,807
Revenue per retail square foot(4) $ 905 $ 879 $ 827
Number of stores(3)
U.S. Best Buy stores 668 608 548
Magnolia Audio Video stores 20 22 19
Future Shop stores 114 108 104
Canadian Best Buy stores 30 19 8
(1) Diluted earnings per share for fiscal 2004 and fiscal 2003 have been restated to reflect the adoption of EITF Issue No. 04-08,
The Effect of Contingently Convertible
Instruments on Diluted Earnings per Share
(2) Represents total debt (including current portion of long-term debt) divided by total capitalization (total debt + total shareholders’ equity)
(3) At period end
(4) Represents revenue divided by weighted average retail square footage
Product Revenue Mix (fiscal 2005)
Our consumer electronics product group—
including TVs, DVD players, MP3 players,
cameras and audio equipment—increased
in the revenue mix for fiscal 2005.
39%
Consumer
Electronics
6%
Appliances
34%
Home Office
21%
Entertainment
Software
FY 05FY 04FY 03
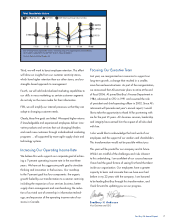
Market Share
We increased our market share in fiscal
2005 by opening new stores and improving
our execution at existing stores.
Source: Company internal estimates and
NPD Group Point-of-Sale data
17%
15%
14%
Best Buy U.S. Market Share (calendar year data)