Bank of Montreal 2010 Annual Report Download - page 2
Download and view the complete annual report
Please find page 2 of the 2010 Bank of Montreal annual report below. You can navigate through the pages in the report by either clicking on the pages listed below, or by using the keyword search tool below to find specific information within the annual report.-
 1
1 -
 2
2 -
 3
3 -
 4
4 -
 5
5 -
 6
6 -
 7
7 -
 8
8 -
 9
9 -
 10
10 -
 11
11 -
 12
12 -
 13
13 -
14
-
15
-
16
-
17
-
18
-
19
-
20
-
21
-
22
-
23
-
24
-
25
-
26
-
27
-
28
-
29
-
30
-
31
-
32
-
33
-
34
-
35
-
36
-
37
-
38
-
39
-
40
-
41
-
42
-
43
-
44
-
45
-
46
-
47
-
48
-
49
-
50
-
51
-
52
-
53
-
54
-
55
-
56
-
57
-
58
-
59
-
60
-
61
-
62
-
63
-
64
-
65
-
66
-
67
-
68
-
69
-
70
-
71
-
72
-
73
-
74
-
75
-
76
-
77
-
78
-
79
-
80
-
81
-
82
-
83
-
84
-
85
-
86
-
87
-
88
-
89
-
90
-
91
-
92
-
93
-
94
-
95
-
96
-
97
-
98
-
99
-
100
-
101
-
102
-
103
-
104
-
105
-
106
-
107
-
108
-
109
-
110
-
111
-
112
-
113
-
114
-
115
-
116
-
117
-
118
-
119
-
120
-
121
-
122
-
123
-
124
-
125
-
126
-
127
-
128
-
129
-
130
-
131
-
132
-
133
-
134
-
135
-
136
-
137
-
138
-
139
-
140
-
141
-
142
-
143
-
144
-
145
-
146
-
147
-
148
-
149
-
150
-
151
-
152
-
153
-
154
-
155
-
156
-
157
-
158
-
159
-
160
-
161
-
162
-
163
-
164
-
165
-
166
-
167
-
168
-
169
-
170
-
171
-
172
-
173
-
174
-
175
-
176
 |
 |

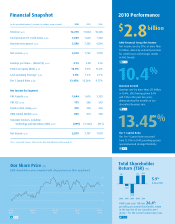
$2.8billion
BMO Financial Group Net Income
Net income rose by 57%, or more than
$1 billion, driven by reduced provisions
for credit losses and stronger results
in P&C Canada.
13.45%
Tier 1 Capital Ratio
The Tier 1 Capital Ratio increased
from 12.24% in 2009, providing greater
operational and strategic flexibility.
Revenue Growth
Revenue rose by more than $1.1 billion,
or 10.4%, after having grown 8.4%
and 9.2% in the past two years,
demonstrating the benefits of our
diversified business mix.
10.4%
Our Share Price ($)
BMO shareholders were rewarded with strong returns on their investment.
Total Shareholder
Return (TSR) (%)
BMO’s one-year TSR was 26.4%
,
providing an annual shareholder return
in the top tier of our Canadian peer
group – for the second consecutive year.
5.9%
5-Year TSR
Oct 31 Jan 31 Apr 30 Jul 31 Oct 31
2009 2010 2010 2010 2010
65
60
55
50 20102009200820072006
24.1
(5.8)
(27.9)
26.4
25.1
2010 Performance
Financial Snapshot
For the year ended October 31 (Canadian $ in millions, except as noted) 2010 2009 2008
Revenue (p 37) 12,210 11,064 10,205
Total provision for credit losses (p 40) 1,049 1,603 1,330
Non-interest expense (p 41) 7,590 7,381 6,894
Net income (p 33) 2,810 1,787 1,978
Earnings per share – diluted ($) (p 33) 4.75 3.08 3.76
Return on equity (ROE) (p 34) 14.9% 9.9% 13.0%
Cash operating leverage1 (p 41) 7.5% 1.3% 4.7%
Tier 1 Capital Ratio (p 60) 13.45% 12.24% 9.77%
Net Income by Segment
P&C Canada (p 47) 1,644 1,415 1,153
P&C U.S. (p 50) 175 286 242
Private Client Group (p 53) 470 359 426
BMO Capital Markets (p 56) 820 873 568
Corporate Services, including
Technology and Operations (T&O) (p 57) (299) (1,146) (411)
Net Income (p 33) 2,810 1,787 1,978
1 This is a non-GAAP measure. Please see the Non-GAAP Measures section on page 91.
P 33
P 37
P 60
P 32P 32