Bank of Montreal 2010 Annual Report Download
Download and view the complete annual report
Please find the complete 2010 Bank of Montreal annual report below. You can navigate through the pages in the report by either clicking on the pages listed below, or by using the keyword search tool below to find specific information within the annual report.-
 1
1 -
 2
2 -
 3
3 -
 4
4 -
 5
5 -
 6
6 -
 7
7 -
 8
8 -
 9
9 -
 10
10 -
 11
11 -
 12
12 -
13
-
14
-
15
-
16
-
17
-
18
-
19
-
20
-
21
-
22
-
23
-
24
-
25
-
26
-
27
-
28
-
29
-
30
-
31
-
32
-
33
-
34
-
35
-
36
-
37
-
38
-
39
-
40
-
41
-
42
-
43
-
44
-
45
-
46
-
47
-
48
-
49
-
50
-
51
-
52
-
53
-
54
-
55
-
56
-
57
-
58
-
59
-
60
-
61
-
62
-
63
-
64
-
65
-
66
-
67
-
68
-
69
-
70
-
71
-
72
-
73
-
74
-
75
-
76
-
77
-
78
-
79
-
80
-
81
-
82
-
83
-
84
-
85
-
86
-
87
-
88
-
89
-
90
-
91
-
92
-
93
-
94
-
95
-
96
-
97
-
98
-
99
-
100
-
101
-
102
-
103
-
104
-
105
-
106
-
107
-
108
-
109
-
110
-
111
-
112
-
113
-
114
-
115
-
116
-
117
-
118
-
119
-
120
-
121
-
122
-
123
-
124
-
125
-
126
-
127
-
128
-
129
-
130
-
131
-
132
-
133
-
134
-
135
-
136
-
137
-
138
-
139
-
140
-
141
-
142
-
143
-
144
-
145
-
146
-
147
-
148
-
149
-
150
-
151
-
152
-
153
-
154
-
155
-
156
-
157
-
158
-
159
-
160
-
161
-
162
-
163
-
164
-
165
-
166
-
167
-
168
-
169
-
170
-
171
-
172
-
173
-
174
-
175
-
176
 |
 |

193RD ANNUAL REPORT 2010
Table of contents
-
Page 1
193 RD ANNUAL REPORT 2010 -
Page 2
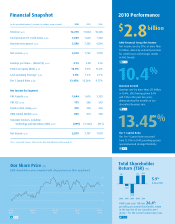
...) Cash operating leverage 1 (p 41) Tier 1 Capital Ratio (p 60) 4.75 14.9% 7.5% 13.45% 3.08 9.9% 1.3% 12.24% 3.76 13.0% 4.7% 9.77% 10.4 P 37 % Net Income by Segment P&C Canada (p 47) P&C U.S. (p 50) Private Client Group (p 53) BMO Capital Markets (p 56) Corporate Services, including Technology... -
Page 3
...Business Review 2 4 5 8 Our Strategic Agenda Chairman's Message President and Chief Executive Officer's Message Our relationship with money is changing Corporate Directory 19 Corporate Governance 20 Our Board of Directors 21 Our Governance Structure 22 Management Committee and Performance Committee... -
Page 4
..., commercial, corporate and institutional customers in North America and internationally. Our operating groups - Personal and Commercial Banking, BMO Bank of Montreal in Canada and Harris in the United States; Private Client Group, our wealth management business; and BMO Capital Markets - share one... -
Page 5
... and sales force productivity. P 28, 45, 48 Accelerate the growth of our wealth management business through client-focused financial planning and by investing for future growth. P 28, 51 Deliver strong, stable returns in our capital markets business by providing highly targeted solutions to... -
Page 6
...time and money to the United Way. They also embraced the bank's environmental goals and helped us, during the course of the year, achieve carbon neutrality relative to energy consumption and transportation emissions. David A. Galloway Chairman of the Board 4 BMO Financial Group 193rd Annual Report... -
Page 7
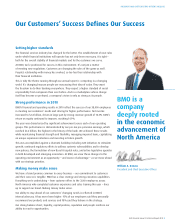
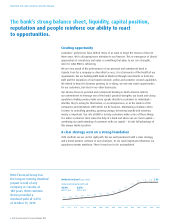
... our products and services and 98% said they believe in the strategy. Our strong balance sheet, liquidity, capital position, reputation and people reinforce our ability to react to opportunities. William A. Downe President and Chief Executive Officer BMO Financial Group 193rd Annual Report 2010 5 -
Page 8
...is much yet to be accomplished. BMO Financial Group has the longest-running dividend payout record of any company in Canada, at 182 years. BMO common shares provided a dividend yield of 4.65% at October 31, 2010. Dividends Declared ($ per share) Compound annual growth rate 2.26 1.85 1.59 0.94 1.00... -
Page 9
.... BMO is a company deeply rooted in the economic success of North America, serving customers for 193 years. For our shareholders, we are committed to building the value of the bank and demonstrating consistent growth in common share dividends over time. Our strategic path is clear; we are focused on... -
Page 10
... right levels of debt and savings. They want a financial coach who'll keep them on their game year in, year out. Above all, people want an institution to practice what it preaches by presenting options with a broad and balanced perspective. Bankers cannot simply be sellers of investment products or... -
Page 11
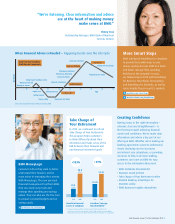
...first job Opening an account 10 20 30 Planning for your estate Caring for a loved one Getting divorced 40 50 60 70 80 90 Buying a car Getting married Starting a business Losing a job Age Having a baby Source: The Investment Funds Institute of Canada (2010) Buying your first home Take Charge... -
Page 12
... financial services, what matters as much as cost is transparency. Customers want clear explanations of exactly what each service entails. They expect fees to be reasonable and fair. Innovation is another driver of value. People welcome the convenience of new technologies and the precious time that... -
Page 13
... their portfolios. BMO currently offers 30 ETFs. At BMO Nesbitt Burns, the Architect Program is making it possible for investors to hold both managed and non-managed investment vehicles in a single account. Customers enjoy a clear view of their total investment picture, along with the benefits of... -
Page 14
... requires stores. Classrooms have become online spaces. Employees work from home or take their virtual offices on the road. Markets are defined as much by the exchange of bits and bytes as they are by trade in goods and services. At the same time, people are travelling further and more frequently... -
Page 15
... and company information. And our Twitter feed helps clients who use social media get BMO Capital Markets information in real time. Experts on Demand Team members come together from across financial disciplines to ensure the solutions we provide fit with the client's overall financial picture... -
Page 16
... and by upholding the principles of responsible management, maintaining capital strength and strategically managing risk in complex global markets. As Canada's financial sector reaffirms its stewardship role in ensuring economic stability, governance practices must be rigorous and transparent. Codes... -
Page 17
... and stability that stand out." Scott Ferris Managing Director, Harris N.A. Chicago, Illinois Capital Strength BMO is the ninth-largest* bank in North America, measured by market capitalization. We're financially strong, with a Tier 1 Capital Ratio of 13.45%. P 60 Tier 1 Capital Ratio (%) Basel... -
Page 18
... businesses that are catalysts of economic growth. The ability to attract, develop and retain the best people has become a strategic imperative for companies worldwide. Industry leaders engage skilled, imaginative people in designing products that resonate, in devising better models of service... -
Page 19
... of Canada's top employers." Doug Bourque Director, Aboriginal Banking, B.C. & Yukon, BMO Bank of Montreal Victoria, British Columbia Right on the Money Sherry Cooper, Chief Economist, BMO Financial Group, and her highly respected Economics team correctly identified key indicators at the start of... -
Page 20
... offer derivative services • First and only Canadian bank chosen as market maker for FX trading in China • First foreign bank permitted to invest in a Chinese mutual fund company With branches in Beijing, Shanghai, Guangzhou and Hong Kong, as well as our investment banking representative office... -
Page 21
..., proxy circular, quarterly reports, annual information form, news releases, website and industry conferences. In 2010, the board approved a shareholder engagement policy promoting open dialogue and the exchange of ideas with the bank's shareholders. BMO Financial Group 193rd Annual Report 2010 19 -
Page 22
... Review Other public boards: Areva, Danone, Wendel Director since: 1992 16 Nancy C. Southern, President and Chief Executive Officer, ATCO Ltd. and Canadian Utilities Limited Board/Committees: Governance and Nominating, Risk Review, The Pension Fund Society of the Bank of Montreal Other public boards... -
Page 23
... Southern Don M. Wilson III • Oversees the identification, documentation, measurement • Monitors compliance with risk-related regulatory requirements and with internal risk management policies and procedures. and management of significant risks. BMO Financial Group 193rd Annual Report 2010 21 -
Page 24
... Legzdins Managing Director, International and Senior Vice-President Retail Investments Dean Manjuris Head, Full Service Brokerage Line of Business and President and Director, Private Client Division, BMO Nesbitt Burns Peter C. McCarthy President and Chief Executive Officer BMO Life Assurance Barry... -
Page 25
...of Business and President and Director, Private Client Division, BMO Nesbitt Burns, is responsible for the strategic direction of the Private Client Division within our wealth management business. Joined BMO in 1983; in role since November 1999 BMO Capital Markets Corporate Functions Finance Human... -
Page 26
...to the difficult credit conditions and weak economic environment, resulting in overall peer group EPS growth of -80%. Net income available to common shareholders in 2010 was 14 times as high as the 2009 level, due to lower credit losses and low funding costs in 2010. Return on Equity (ROE) P 34 19... -
Page 27
... Canadian peer group, except National Bank of Canada, as well as BB&T Corporation, Fifth Third Bancorp, Key Corp., Bank of New York Mellon, The PNC Financial Services Group Inc., Regions Financial, SunTrust Banks Inc. and U.S. Bancorp. The North American peer group was redeï¬ned in 2010. Prior year... -
Page 28
... key measures that assess or most directly inï¬,uence shareholder return. Total Shareholder Return Earnings per Share Growth Return on Equity Net Economic Profit Growth 2010 Financial Performance Review provides a detailed review of BMO's consolidated financial performance by major income statement... -
Page 29
...customers across Canada through our Canadian retail arm, BMO Bank of Montreal. We also serve customers through our wealth management businesses, BMO Nesbitt Burns, BMO InvestorLine, BMO Insurance and BMO Harris Private Banking. BMO Capital Markets, our North American investment and corporate banking... -
Page 30
...-based bank, in a transaction assisted by the Federal Deposit Insurance Corporation (FDIC), accelerating our growth strategy and adding quality locations and a good customer base. Accelerate the growth of our wealth management business through client-focused financial planning and by investing for... -
Page 31
... in any forward-looking statements. The Enterprise-Wide Risk Management section starting on page 75 describes a number of risks, including credit and counterparty, market, liquidity and funding, insurance, operational, business, model, strategic, reputation and environmental risks. The sections that... -
Page 32
... our future business prospects. Information about certain legal and regulatory matters we currently face is provided in Note 28 on page 159 of the financial statements. Execution of Strategy Our financial performance is influenced by our ability to execute strategic plans developed by management. If... -
Page 33
... 2010, supporting consumer spending and personal credit growth. However, personal deposit growth slowed, as an increase in investors' risk tolerance redirected savings toward equity mutual funds. Businesses continued to finance spending from cash flow and new bond issuances, limiting business credit... -
Page 34
... of quarterly dividends and therefore does not equal the sum of dividend and share price returns in the table. (1) Compound annual growth rate (CAGR) expressed as a percentage. (2) As a percentage of the closing market price in the prior year. 32 BMO Financial Group 193rd Annual Report 2010 -
Page 35
... as higher insurance premiums, including the benefit of a full year's results from the BMO Life Assurance acquisition that occurred late in the second quarter of 2009. PCG results are discussed in the operating group review on page 51. BMO Capital Markets (BMO CM) net income decreased $53 million... -
Page 36
... and 2010, we decided to strengthen equity and associated capital ratios to support investors' and depositors' confidence and provide greater operational and strategic flexibility. The increase in equity has contributed to our ROE falling short of our historic returns and medium-term objectives. BMO... -
Page 37
... current year. The other operating groups also made significant contributions, with strong revenue growth in Corporate Services and revenue growth of 12% in Private Client Group, 6% in BMO Capital Markets and 2% in P&C U.S. on a U.S. dollar basis. • • • • The provision for credit losses... -
Page 38
... for the past three years, each one cent decrease in the Canadian/U.S. dollar exchange rate, expressed in terms of how many Canadian dollars one U.S. dollar buys, would be expected to change the Canadian dollar equivalents of U.S.dollar-denominated net income (loss) before income taxes by between... -
Page 39
... assets ($ millions) Change 2010 2009 $ % Net interest margin (in basis points) 2010 2009 Change P&C Canada P&C U.S. Personal and Commercial Banking (P&C) Private Client Group (PCG) BMO Capital Markets (BMO CM) Corporate Services, including Technology and Operations Total BMO (1) 4,164 1,092... -
Page 40
... of BMO Life Assurance, which increased assets with no change to net interest income. BMO Capital Markets net interest income decreased $134 million or 9%. Revenues from interest-rate-sensitive businesses and corporate banking were lower, while trading net interest income was higher. The group... -
Page 41
...from foreign exchange, other than trading, increased $40 million or 75%, reflecting growth in P&C Canada, Private Client Group and Corporate Services. Insurance income increased $26 million or 9%, due in part to higher premiums and the inclusion of a full year's results of BMO Life Assurance in 2010... -
Page 42
... limits. Credit risk management is discussed further on page 80. Note 4 on page 120 of the financial statements and Tables 11 to 19 on pages 102 to 105 provide details of BMO's loan portfolio, impaired loans and provisions and allowances for credit losses. 40 BMO Financial Group 193rd Annual Report... -
Page 43
..., BMO's cash productivity ratio improved by 46 basis points. Examples of initiatives to enhance productivity are outlined in the 2010 Review of Operating Groups Performance, which starts on page 42. Operating leverage was 7.6% and cash operating leverage was 7.5%. Our medium-term goal, over time, is... -
Page 44
... employees a fee-based subsidy on annual credit card fees. Stock options and deferred share units granted to directors, and preferred rate loan agreements for executives relating to transfers we initiate, are discussed in Note 27 on page 159 of the financial statements. 2010 Review of Operating... -
Page 45
..., Net Income and Average Assets by Operating Group and by Location ($ millions, except as noted) Personal and Commercial Banking For the year ended October 31 2010 2009 2008 2010 Private Client Group 2009 2008 2010 BMO Capital Markets 2009 2008 Corporate Services, including Technology and Operations... -
Page 46
MANAGEMENT'S DISCUSSION AND ANALYSIS Personal and Commercial Banking (Canadian $ in millions, except as noted) P&C Canada Fiscal 2010 Fiscal 2009 Fiscal 2008 Change from 2009 $ % Fiscal 2010 P&C U.S. Fiscal 2009 Fiscal 2008 Change from 2009 $ % Fiscal 2010 Fiscal 2009 P&C Fiscal 2008 Change from ... -
Page 47
... commercial banking, reflected in our number two ranking in market share for business loans of $5 million and less. Largest MasterCard issuer in Canada, as measured by transaction volumes, and one of the top commercial card issuers in North America. Highly experienced team of senior account managers... -
Page 48
...) Total deposit growth (%) Commercial ($ billions) Personal ($ billions) Revenue growth (%) Cash productivity ratio (%) Net income growth (%) ROE (%) MD&A Personal and Cards ($ billions) There was loan growth across all products. Deposit growth was lowered by a return of client preferences... -
Page 49
... costs, the $45 million impact of the inclusion of the results of the Diners Club business in the current year and higher employee-related costs. Our cash productivity ratio improved 260 basis points to 51.0%, as revenue growth outpaced expense growth. BMO Financial Group 193rd Annual Report 2010... -
Page 50
... management. Segments of focus are business banking, corporate finance, diversified industries, financial institutions, food and consumer and commercial real estate. We also offer wealth management and investment banking services through our partners in Private Client Group and BMO Capital Markets... -
Page 51
... our number two ranking in personal deposit market share in the Chicago metropolitan market, while some larger banks lost market share and overall market deposit levels fell. • Increased the scale of our commercial bank by transferring select U.S. mid-market clients from BMO Capital Markets to... -
Page 52
... growth as the United States emerges from recession, we identified U.S. mid-market clients that would be better served by a commercial banking model and transferred their business to P&C U.S. from BMO Capital Markets in the second quarter of 2010. As a result, P&C U.S. assumed $5.4 billion in loans... -
Page 53
...operates as BMO Harris Private Banking in Canada and Harris Private Bank in the United States. We deliver a planning and advice-based value proposition to high net worth and ultra-high net worth clients, offering a comprehensive range of services. Retail Investments operates as BMO Mutual Funds, BMO... -
Page 54
...Cash Productivity Ratio (%) Net Income and Return on Equity 426 37.9 359 29.4 470 37.4 2010 Revenue by Line of Business (%) Full-Service Investing 42% BMO Insurance 13% BMO Asset Management 5% Retail Investments 13% Private Banking 20% Self-Directed Investing 7% 77.8 72.9 71.5 2008 Canada United... -
Page 55
... in the Canadian and U.S. economies in 2010. Stronger equity markets contributed to growth in our asset levels and related fee-based revenues. Net interest income grew moderately, constrained by historically low interest rates but benefiting from increased cash holdings as some clients held liquid... -
Page 56
... North American and international financial institutions. Trading Products services include sales, trading and research activities. We offer integrated debt, foreign exchange, interest rate, credit, equity, securitization and commodities solutions to institutional, commercial and retail clients. In... -
Page 57
...' 2010 U.S. Equity Analysts study. • Ranked 1st in 2010 Canadian Fixed-Income Research Quality and 1st in 2010 Canadian Fixed-Income Market Share - Overall in Greenwich Associates' 2010 client study. • Named Best Trade Bank in Canada by Trade Finance Magazine. • Moved into Top 20 Global Equity... -
Page 58
... billion in deposits, with results for prior periods restated to reflect the transfer. Transferring accounts that are primarily lending-based to P&C U.S. allows 56 BMO Financial Group 193rd Annual Report 2010 BMO Capital Markets (Canadian $ in millions, except as noted) As at or for the year ended... -
Page 59
...real estate and sourcing for BMO Financial Group. T&O focuses on enterprisewide priorities that improve service quality and efficiency to deliver an excellent customer experience. Corporate Services, including Technology and Operations (Canadian $ in millions, except as noted) As at or for the year... -
Page 60
... reduce shareholders' equity, while Note 20 on page 145 of the financial statements provides details on the components of and changes in share capital. Details of our enterprise-wide capital management practices and strategies can be found on page 59. 58 BMO Financial Group 193rd Annual Report 2010 -
Page 61
..., based on changes in our business activities, risk profile or operating environment. Governance The Board of Directors and its Risk Review Committee provide ultimate oversight and approval of capital management, including our capital management corporate policy, capital plan and ICAAP results... -
Page 62
... are our key measures of capital adequacy, and both were strong in 2010. Subordinated debt Trust subordinated notes Accumulated net after-tax unrealized gains on available-for-sale equity securities Eligible portion of general allowance for credit losses Total Tier 2 capital Securitization-related... -
Page 63
... net investment in our U.S. operations by funding the net investment in U.S. dollars. This strategy reduces the impact on our capital ratios of changes in foreign exchange rates, as the effect of foreign currency adjustments to Tier 1 capital arising from changes in the value of the Canadian dollar... -
Page 64
... key changes associated with the adoption of IFRS, based on our analysis to date, as set out in Transition to International Financial Reporting Standards in the Future Changes in Accounting Policies - IFRS section on page 71, BMO's proforma October 31, 2010 Common Equity Ratio and Tier 1 Capital... -
Page 65
... rate of 4.46% for BMO's total U.S. first mortgage loan portfolio. We also had net exposure of US$69 million (US$101 million in 2009) to a business that buys distressed mortgages (including subprime mortgages) at a discounted price. Home equity products are secured by the homeowner's equity and rank... -
Page 66
...660 and maximum loan-to-value ratios of 80% (90% with private mortgage insurance). Due to these lending requirements, the credit quality of our Alt-A portfolio is strong and the loans have performed relatively well. In the United States, our direct Alt-A loans totalled US$0.9 billion at year end (US... -
Page 67
... in 2009). The asset-backed securities issued to third-party investors by the vehicle holding credit card loans are rated AAA by DBRS and Aaa by Moody's. Further information on the impact of securitization activities on the consolidated financial statements is outlined in Note 8 on page 126 of the... -
Page 68
... amount of their investment. The book value of the subordinated capital notes in Links and Parkland at October 31, 2010 was US$689 million and â,¬141 million, respectively. Subsequent to year end, the SIVs recorded impairment charges related to Irish bank and insurance company subordinate debt of... -
Page 69
...financial services industry more generally. We anticipate an increase in compliance costs and regulatory enforcement, and will be focused on managing the impact, particularly on our U.S. business, of regulatory changes given their complexity and breadth. BMO Financial Group 193rd Annual Report 2010... -
Page 70
... to raise capital, through the issuance of $450 million of BMO Tier 1 Notes - Series A. Trust II used the proceeds of the offering to purchase a senior deposit note from BMO. We are not required to consolidate Trust II. Credit Instruments In order to meet the financial needs of our clients, we use... -
Page 71
... quoted market prices (Level 1), internal models using observable market information (Level 2) and internal models without observable market information (Level 3) in the valuation of securities, derivative assets and derivative liabilities as at October 31, 2010, as well as a sensitivity analysis of... -
Page 72
... using high-quality corporate bonds with terms matching the plans' specific cash flows. Additional information regarding our accounting for pension and other employee future benefits, including a sensitivity analysis for key assumptions, is included in Note 23 on page 149 of the financial statements... -
Page 73
...rates on pension obligations (market-related amounts). We can either BMO Financial Group 193rd Annual Report 2010 71 MD&A A detailed implementation plan was developed and approved by the IFRS Executive Steering Committee in 2009. Potential differences between IFRS and the bank's current accounting... -
Page 74
MANAGEMENT'S DISCUSSION AND ANALYSIS record these market-related amounts directly in equity or defer them on our balance sheet and amortize amounts in excess of 10% of our plan assets or benefit liability balances to pension expense over a period of approximately 12 years. We currently follow the ... -
Page 75
... IFRS-based information for the IFRS comparative year, changes in the accounting treatment of the bank's VIEs and securitized loans and certain additional disclosure requirements in the notes to the financial statements. These internal control modifications will be a key area of focus in the... -
Page 76
...' Auditors' Services and Fees Pre-Approval Policies and Procedures As part of BMO Financial Group's corporate governance practices, the Board of Directors ensures the strict application of BMO's corporate policy limiting the services provided by the Shareholders' Auditors that are not related to... -
Page 77
... review and oversight function across the enterprise on risk-related issues. "Risk trends were generally positive in 2010 with credit costs down from 2009 and lower levels of market volatility." Our Priorities MD&A Tom Flynn Executive Vice-President and Chief Risk Officer BMO Financial Group... -
Page 78
... changing economic environment. • Delivered strong credit performance with significantly lower credit losses year over year. • Managed market risk positions without significant volatility. • Reduced exposure to certain run-off portfolios. Work with the operating groups to advance new business... -
Page 79
... corporate policies, which are approved by the Enterprise-Wide Risk Management Framework Board of Directors Risk Review Committee Audit Committee CEO First Line of Defence Second Line of Defence Operating Groups Risk Management Group Own the Risks Associated with Business Activities Policies... -
Page 80
... financial reporting. President and Chief Executive Officer (CEO) is directly accountable to the board for all of BMO's risk-taking activities. The CEO is supported by the Risk Management Committee and its sub-committees, as well as Enterprise Risk and Portfolio Management. Risk Management Committee... -
Page 81
... of business returns; and incentive compensation programs are designed and implemented to incorporate motivation that balances short-, medium- and long-term profit generation with the achievement of sustainable, non-volatile earnings growth, in line with our risk appetite. New products and services... -
Page 82
... portfolio at October 31, 2010, was as follows: PD risk profile PD range % of Retail EAD Credit and counterparty risk exists in every lending activity that BMO enters into, as well as in the sale of treasury and other capital markets products, the holding of investment securities and securitization... -
Page 83
...equity loans - Canada Home equity loans - U.S. Credit cards Personal loans - Canada Personal loans - U.S. Commercial mortgages Commercial real estate Construction Policies and Standards BMO's credit risk management framework is built on governing principles defined in a series of corporate policies... -
Page 84
... interest rate, foreign exchange rate, equity and commodity prices and their implied volatilities. This measure calculates the maximum likely loss from portfolios, measured at a 99% confidence level over a specified holding period. Issuer Risk arises in BMO's trading and underwriting portfolios, and... -
Page 85
... determine market risk Economic Capital for each of the lines of business and to determine regulatory capital. For capital calculation purposes, longer holding periods and/or higher confidence levels are used than are employed in day-to-day risk management. Prior to use, models are subject to review... -
Page 86
... fees and commissions directly related to those activities. Structural market risk is comprised of interest rate risk arising from our banking activities (loans and deposits) and foreign exchange risk arising from our foreign currency operations. Structural market risk is managed by BMO's Corporate... -
Page 87
..., stress testing and gap analysis to measure and manage interest rate risk. The interest-rate gap position is disclosed in Note 19 on page 143 of the financial statements. Models used to measure structural market risk project how interest rates and foreign exchange rates may change and predict how... -
Page 88
...-Term Note Programs, a Global Covered Bond Program, Canadian and U.S. mortgage securitizations, Canadian credit card securitizations, and Canadian and U.S. senior (unsecured) deposits. Information on deposit maturities can be found in Table 20 on page 106. The credit ratings assigned to BMO's senior... -
Page 89
... to senior management and our Board of Directors on a regular basis. BMO is a member of the Operational Risk Data Exchange, an international association of banks that share loss data information anonymously to assist in risk identification, assessment and modelling. Capital Quantification BMO uses... -
Page 90
...also address expected loss and its applications; BMO uses models that range from the very simple to those that value complex transactions or involve sophisticated portfolio and capital management methodologies. These models are used to guide strategic 88 BMO Financial Group 193rd Annual Report 2010 -
Page 91
...financial information linked to financial commitments. The OSM works with the lines of business and key corporate stakeholders during the strategy development process to promote consistency and adherence to strategic management standards. Included in this process is a review of the changing business... -
Page 92
... and the United States and purchasing high-quality carbon offsets to neutralize the remaining emissions. BMO committed $10 million over five years to the Greening Canada Fund, the first voluntary carbon emissions reduction fund open only to Canadian corporations. The fund provides direct access to... -
Page 93
... to derive cash productivity and cash operating leverage measures. Net economic profit represents cash net income available to common shareholders, less a charge for capital, and is considered an effective measure of added economic value. Income before provision for credit losses, income taxes... -
Page 94
... and the effect on results in 2009 of credit card securitizations completed in 2008. Non-interest expense was $148 million higher, largely related to a $118 million ($80 million after tax) severance charge and higher deposit insurance premiums. MD&A 92 BMO Financial Group 193rd Annual Report 2010 -
Page 95
... by higher credit losses, the impact of impaired loans and acquisition integration costs. Private Client Group produced strong results with net income substantially higher than in the same quarter a year ago, with strong revenue growth. Results for BMO Capital Markets reflected revenue growth, from... -
Page 96
...but mergers and acquisitions fees and debt underwriting revenues were higher. BMO Capital Markets has refocused its business over the past three years with the goal of improving its risk-return profile and concentrating on core profitable client relationships. Corporate Services quarterly net income... -
Page 97
... BMO Capital Markets Corporate Services, including T&O BMO Financial Group net income Information per Common Share ($) Dividends declared Earnings Basic Diluted Cash earnings Basic Diluted Book value Market price High Low Close Financial Measures (%) Five-year average annual total shareholder return... -
Page 98
... 2002 2001 Market Price per Common Share ($) High Low Close Common Share Dividends Dividends declared per share ($) Dividends paid per share ($) Dividend payout ratio (%) Dividend yield (%) Total Shareholder Return (%) Five-year average annual return One-year return Common Share Information Number... -
Page 99
... bearing deposits with banks Securities Securities borrowed or purchased under resale agreements Net loans and acceptances Other assets Total assets Liabilities and Shareholders' Equity Deposits Other liabilities Subordinated debt Capital trust securities Preferred share liability Share capital... -
Page 100
... fees Card fees Investment management and custodial fees Mutual fund revenues Securitization revenues Underwriting and advisory fees Securities gains (losses), other than trading Foreign exchange, other than trading Insurance income Other revenues Total non-interest revenue Year-over-year growth... -
Page 101
... Business and capital taxes Professional fees Travel and business development Other Total other expenses Amortization of intangible assets Restructuring charge (reversal) Total Non-Interest Expense Year-over-year growth (%) Non-interest expense-to-revenue ratio (Productivity ratio) (%) Government... -
Page 102
... rate (%) 2008 Interest income/ expense Assets Canadian Dollar Deposits with other banks Securities Securities borrowed or purchased under resale agreements Loans Residential mortgages Non-residential mortgages Consumer instalment and other personal Credit cards Businesses and governments Total... -
Page 103
... other personal Credit cards Businesses and governments Total loans Other non-interest bearing assets Change in Canadian dollar interest income U.S. Dollar and Other Currencies Deposits with other banks Securities Securities borrowed or purchased under resale agreements Loans Residential mortgages... -
Page 104
... Information Canada As at October 31 2010 2009 2008 2007 2006 ($ millions, except as noted) United States 2010 2009 2008 2007 2006 2010 Other countries 2009 2008 2007 2006 Consumer Residential mortgages (1) Cards Consumer instalment and other personal loans Total consumer Commercial and corporate... -
Page 105
... in Canada Net Commercial and Corporate Loans by Industry Commercial mortgages (5) Commercial real estate Construction (non-real estate) Retail trade Wholesale trade Agriculture Communications Manufacturing Mining Oil and gas Transportation Utilities Forest products Service industries Financial... -
Page 106
... Information ($ millions, except as noted) Canada As at October 31 2010 2009 2008 2007 2006 2010 2009 United States 2008 2007 2006 2010 Other countries 2009 2008 2007 2006 Consumer Residential mortgages Consumer instalment and other personal loans Total consumer Commercial and corporate Off-balance... -
Page 107
... (non-real estate) Retail trade Wholesale trade Agriculture Communications Manufacturing Mining Oil and gas Transportation Utilities Forest products Service industries Financial institutions Government Other Total specific allowances for credit losses on commercial and corporate loans (2) 55... -
Page 108
... 3 years 3 to 5 years Over 5 years No fixed maturity Total On-Balance Sheet Financial Instruments Deposits (1) Subordinated debt (2) Capital trust securities (2) Other financial liabilities (2) (1) Deposits exclude interest payments as well as structured notes designated under the fair value option... -
Page 109
... As at October 31 Amortized cost Fair value (1) 2010 2009 2008 2007 ($ millions) 2006 Canadian governments debt U.S. governments debt Mortgage-backed securities - Canada - United States Corporate debt Corporate equity Other governments debt Total available-for-sale securities 16,074 9,622 7,945... -
Page 110
... of our policies and procedures governing corporate conduct and risk management; comprehensive business planning; effective segregation of duties; delegation of authority and personal accountability; escalation of relevant information for decisions regarding public disclosure; careful selection and... -
Page 111
... Public Accountants Toronto, Canada December 7, 2010 To the Shareholders and Board of Directors of Bank of Montreal We have audited Bank of Montreal's (the "bank") internal control over financial reporting as of October 31, 2010, based on the criteria established in Internal Control - Integrated... -
Page 112
... notes are an integral part of these consolidated financial statements. Certain comparative figures have been reclassified to conform with the current year's presentation. $ 411,640 $ 388,458 William A. Downe President and Chief Executive Officer 110 BMO Financial Group 193rd Annual Report 2010... -
Page 113
... fees Deposit and payment service charges Trading revenues Lending fees Card fees Investment management and custodial fees Mutual fund revenues Securitization revenues (Note 8) Underwriting and advisory fees Securities gains (losses), other than trading (Note 3) Foreign exchange, other than trading... -
Page 114
... (net of income tax (provision) recovery of $(206), $(382) and $881) Balance at End of Year Total Accumulated Other Comprehensive Loss Total Shareholders' Equity The accompanying notes are an integral part of these consolidated financial statements. 112 BMO Financial Group 193rd Annual Report 2010... -
Page 115
...(Note 18) Share issue expense Cash dividends paid Net Cash Provided by (Used in) Financing Activities Cash Flows from Investing Activities Net decrease in interest bearing deposits with banks Purchases of securities, other than trading Maturities of securities, other than trading Proceeds from sales... -
Page 116
... Risk Share Capital Capital Management Employee Compensation - Stock-Based Compensation Employee Compensation - Pension and Other Employee Future Benefits Income Taxes Earnings Per Share Operating and Geographic Segmentation Related Party Transactions Contingent Liabilities Fair Value of Financial... -
Page 117
... and fees collected from customers, net of the yield paid to investors in the securitization vehicle, would be recorded in net interest income using the effective interest rate method over the term of the securitization and credit losses associated with loans and mortgages would be recorded in... -
Page 118
...sale. Interest and dividend income of $26 million related to the transferred securities was recorded in interest, dividend and fee income, securities in our Consolidated Statement of Income for the year ended October 31, 2010 ($57 million in 2009). Notes 116 BMO Financial Group 193rd Annual Report... -
Page 119
... we purchase for resale over a short period of time. We report these securities at their fair value and record the fair value changes and transaction costs in our Consolidated Statement of Income in trading revenues. Fair Value Option Securities designated as trading under the fair value option are... -
Page 120
...BMO Financial Group 193rd Annual Report 2010 Certain comparative figures have been reclassified to conform with the current year's presentation. Yields in the table above are calculated using the cost or amortized cost of the security and the contractual interest or stated dividend rates associated... -
Page 121
...supported by insured mortgages. Income from securities has been included in our consolidated financial statements as follows: (Canadian $ in millions) 2010 2009 2008 Reported in Consolidated Statement of Income: Interest, Dividend and Fee Income (1) Trading securities Available-for-sale securities... -
Page 122
... income. Payments received on corporate and commercial loans that have been classified as impaired are applied first to the recovery of collection 120 BMO Financial Group 193rd Annual Report 2010 Notes Provision for Credit Losses Changes in the value of our loan portfolio due to credit-related... -
Page 123
... (2) 2010 2009 Net of specific allowance 2010 2009 Residential mortgages Consumer instalment and other personal loans Business and government loans Total By geographic region (1): Canada United States Other countries Total (1) Geographic region is based upon the country of ultimate risk. (2) 2010... -
Page 124
... in Management's Discussion and Analysis on pages 80 to 81 of this report. Additional information on loans and derivative-related credit risk is disclosed in Notes 4 and 10, respectively. Concentrations of Credit and Counterparty Risk Concentrations of credit risk exist if a number of clients are... -
Page 125
... million. Retail Credit Drawn Exposure by Portfolio and Risk Rating (Canadian $ in millions) Residential mortgages and home equity lines of credit 2010 2009 Qualifying revolving retail (1) 2010 2009 Other retail and retail small and medium-sized enterprises 2010 2009 Risk profile (probability of... -
Page 126
..., foreign exchange rates, equity and commodity prices and their implied volatilities, as well as credit spreads, credit migration and default. We incur market risk in our trading and underwriting activities and structural banking activities. Contractual Maturities of Financial Liabilities Financial... -
Page 127
... include amounts that relate to our U.S. customer securitization vehicle discussed in Note 9. Notes Senior Funding Facilities We also provide senior funding support to our structured investment vehicles ("SIVs") and our credit protection vehicle. As at October 31, 2010, $5,097 million had... -
Page 128
...Consolidated Statement of Income for the years ended October 31, 2010, 2009 and 2008: (Canadian $ in millions) 2010 Residential mortgages 2009 2008 2010 Credit card loans 2009 2008 2010 Total 2009 2008 Net cash proceeds (1) Investment in securitization vehicles (2) Deferred purchase price Servicing... -
Page 129
... and other personal loans Credit card loans Business and government loans Total loans Less mortgage-backed securities retained and classified as available-for-sale securities Less loans securitized: Residential mortgages Credit card loans Total loans reported in the Consolidated Balance Sheet... -
Page 130
... fully financed by us through our ownership of ABCP. We are not required to consolidate five of our eight Canadian customer securitization vehicles. Our exposure to loss is limited to the consolidated assets disclosed in the preceding table. Notes 128 BMO Financial Group 193rd Annual Report 2010 -
Page 131
... Notes Structured Investment Vehicles Structured investment vehicles ("SIVs") provide investment opportunities in customized, diversified debt portfolios in a variety of asset and rating classes. We hold interests in two SIVs, Links Finance Corporation BMO Financial Group 193rd Annual Report 2010... -
Page 132
...in commodities prices, securities values, interest rates and foreign exchange rates, as applicable. 130 BMO Financial Group 193rd Annual Report 2010 Uses of Derivatives Trading Derivatives Trading derivatives include derivatives entered into with customers to accommodate their risk management needs... -
Page 133
... loans and deposits as well as assets denominated in foreign currencies. We record interest that we pay or receive on the derivative as an adjustment to interest, dividend and fee income in our Consolidated Statement of Income over the life of the hedge. To the extent that changes in the fair value... -
Page 134
...-traded derivatives is considered to be the price quoted on derivatives exchanges. Fair value for overthe-counter derivatives is determined using multi-contributor prices or zero coupon valuation techniques further adjusted for credit, model and liquidity risks, as well as administration costs... -
Page 135
...Balance Sheet are as follows: (Canadian $ in millions) 2010 Assets 2009 2010 Liabilities 2009 Fair value of trading derivatives Fair value of hedging derivatives Total 46,944 2,815 49,759 45,774 2,124 47,898 47,225 745 47,970 44,139 626 44,765 Notes BMO Financial Group 193rd Annual Report 2010... -
Page 136
... therefore are not recorded in our Consolidated Balance Sheet. (Canadian $ in millions) Hedging Trading Cash flow Fair value Total Trading Cash flow 2010 Hedging Fair value Total 2009 Interest Rate Contracts Over-the-counter Swaps Forward rate agreements Purchased options Written options 1,443,036... -
Page 137
... include interest rates, foreign exchange rates, equity and commodity prices and their implied volatilities, as well as credit spreads, credit migration and default. We strive to limit market risk by employing comprehensive governance and management processes for all market risk-taking activities... -
Page 138
... netting agreements) with customers in the following industries: (Canadian $ in millions) Interest rate contracts 2010 2009 Foreign exchange contracts 2010 2009 Commodity contracts 2010 2009 Equity contracts 2010 2009 Credit default swaps 2010 2009 2010 Total 2009 Financial institutions Government... -
Page 139
... its global securities lending team. The acquisition provides us with the opportunity to expand our securities lending operation. Goodwill related to this acquisition is deductible for tax purposes. This acquisition is part of our BMO Capital Markets reporting segment. Notes BMO Financial Group... -
Page 140
... voting shares of AIG Life Insurance Company of Canada for cash consideration of $330 million, subject to a post-closing adjustment based on net assets. The post-closing adjustment was finalized during 2010 and the purchase price was reduced to $278 million. The acquisition of BMO Life Assurance... -
Page 141
... reporting unit for the years ended October 31, 2010 and 2009 is as follows: Personal and Commercial Banking P&C Canada P&C U.S. Client Investing Investment Products Private Banking Private Client Group BMO Capital Markets Corporate Services Technology and Operations (Canadian $ in millions) Total... -
Page 142
NOTES TO CONSOLIDATED FINANCIAL STATEMENTS Note 15: Deposits Payable on demand (Canadian $ in millions) Interest bearing 2010 2009 Non-interest bearing 2010 2009 Payable after notice 2010 2009 2010 Payable on a fixed date 2009 2010 Total 2009 Deposits by: 606 Banks Businesses and governments (1) ... -
Page 143
... the fair value option and are accounted for at fair value, which better aligns the accounting result with the way the portfolio is managed. The change in fair value of these structured notes was a decrease in non-interest revenue, trading revenues of $110 million for the year ended October 31, 2010... -
Page 144
.... Trust II used the proceeds of the issuance to purchase a senior deposit note from us which is reported as a business and government deposit liability in our Consolidated Balance Sheet. The BMO T1Ns - Series A 142 BMO Financial Group 193rd Annual Report 2010 are redeemable, at the option of Trust... -
Page 145
... date or maturity date of assets, liabilities and derivatives used to manage interest rate risk. The gap position presented is as at October 31 of each year. It represents the position outstanding at the close of the business day and may change significantly in subsequent periods based on customer... -
Page 146
...Capital trust securities Shareholders' equity Total liabilities and shareholders' equity Asset/liability gap position Notional amounts of derivatives Total Canadian dollar interest rate gap position 2010 2009 U.S. Dollar and Other Currencies Assets Cash and cash equivalents Interest bearing deposits... -
Page 147
... the year Issued under the Shareholder Dividend Reinvestment and Share Purchase Plan Issued under the Stock Option Plan (Note 22) Issued on the exchange of shares of a subsidiary corporation Issued on the acquisition of a business Balance at end of year Treasury Shares Share Capital (1) Redeemed... -
Page 148
... at an average of the closing price of our common shares on the Toronto Stock Exchange based on the five trading days prior to the last business day of the month or we may purchase them on the open market at market prices. During the year ended October 31, 2010, we issued a total of 9,749,878 common... -
Page 149
... a cost-effective structure that: meets our target regulatory capital ratios and internal assessment of required economic capital; is consistent with our targeted credit ratings; underpins our operating groups' business strategies; and builds depositor confidence and long-term shareholder value. Our... -
Page 150
... ended October 31, 2010 and 2009: (Canadian $, except as noted) 2010 Weightedaverage grant date Number of fair value stock options 2009 Weightedaverage grant date fair value Other Stock-Based Compensation Plans Share Purchase Plan We offer our employees the option of directing a portion of their... -
Page 151
... Directors, executives, and key employees in BMO Capital Markets and Private Client Group. Under these plans, fees, annual incentive payments and/or commissions can be deferred as stock units of our common shares. These stock units are fully vested on the grant date. The value of these stock units... -
Page 152
... employee future benefit plans in the United States and Canada are either partially funded or unfunded. Pension and benefit payments related to these plans are either paid through the respective plan or paid directly by us. We measure the fair value of plan assets as at October 31 for our Canadian... -
Page 153
... of plan amendment costs Settlement gain Expected return on plan assets Annual benefits expense Canada and Quebec pension plan expense Defined contribution expense Total annual pension and other employee future benefit expenses recognized in the Consolidated Statement of Income (Canadian $ in... -
Page 154
... care cost trend rate Fair value of plan assets Fair value of plan assets at beginning of year Opening adjustment for the inclusion of the United Kingdom plan Actual return on plan assets Employer contributions Voluntary employee contributions Benefits paid to pensioners and employees Settlement... -
Page 155
...future benefit payments in the next five years and thereafter are as follows: (Canadian $ in millions) Pension benefit plans Other employee future benefit plans Notes 2011 2012 2013 2014 2015 2016-2020 251 262 271 283 293 1,617 38 40 43 47 49 293 BMO Financial Group 193rd Annual Report 2010 153 -
Page 156
... Pension Benefit Plans As at October 31, 2010 (Canadian $ in millions) table for the financial instruments held by the bank, provided in Note 29. The extent of our use of quoted market prices (Level 1), internal models using observable market information as inputs (Level 2) and internal models... -
Page 157
... we record an income tax expense or benefit directly in shareholders' equity when the taxes relate to amounts recorded in shareholders' equity. For example, income tax expense (recovery) on hedging gains (losses) related to our net investment in foreign operations is recorded in shareholders' equity... -
Page 158
...in our Consolidated Balance Sheet, excluding any related Canada United States 2003 2004 Note 25: Earnings Per Share Basic Earnings per Share Our basic earnings per share is calculated by dividing our net income, after deducting total preferred share dividends, by the daily average number of fully... -
Page 159
... clients complete financial solutions, including equity and debt underwriting, corporate lending and project financing, mergers and acquisitions, advisory services, merchant banking, securitization, treasury and market risk management, debt and equity research and institutional sales and trading... -
Page 160
... average assets, grouped by operating segment and geographic region, are as follows: (Canadian $ in millions) P&C Canada P&C U.S. PCG BMO CM Corporate Services (1) Total Canada United States Other countries 2010 (2) Net interest income Non-interest revenue Total Revenue Provision for credit losses... -
Page 161
...the Harris Financial Corp. Board of Directors are required to take a specified minimum amount of their annual retainers and other fees in the form of deferred share units. Deferred share units allocated under these deferred share unit plans are adjusted to reflect dividends and changes in the market... -
Page 162
...both trading and available-for-sale, by instrument type and the methods used to determine fair value are provided in Note 3. Derivative Instruments The methods used to determine the fair value of derivative instruments are provided in Note 10. Notes 160 BMO Financial Group 193rd Annual Report 2010 -
Page 163
... debt Capital trust securities Shareholders' equity 249,251 47,970 7,001 16,438 47,110 17,414 3,776 800 21,880 411,640 Total fair value adjustment Certain comparative figures have been reclassified to conform with the current year's presentation. Notes BMO Financial Group 193rd Annual Report 2010... -
Page 164
... 3 instruments is provided below. Within Level 3 trading securities is corporate debt of $1,242 million that relates to securities that are hedged with total return swaps and credit default swaps that are also considered a Level 3 instrument. Notes 162 BMO Financial Group 193rd Annual Report 2010 -
Page 165
... corporate debt securities that were previously valued using observable market information were transferred from Level 2 to Level 1 as values for these securities became available in active markets. During the year ended October 31, 2009, the mid-term notes and associated total return swap related... -
Page 166
... Purchases Sales Maturities (1) Transfers into Level 3 Transfers out of Level 3 Unrealized gains (losses) (2) Trading Securities Issued or guaranteed by: U.S. states, municipalities and agencies Mortgage-backed securities and collateralized mortgage obligations Corporate debt Total trading... -
Page 167
..., as reported under Canadian GAAP Adjustments to arrive at United States GAAP: Net Interest Income - Liabilities and equity (l) Non-Interest Revenue - Merchant banking (f) - Reclassification from trading securities to available-for-sale securities (c) - Insurance (d) - Derivatives (h) - Other... -
Page 168
...-for-sale securities. Under Canadian GAAP , fixed income and equity investments supporting the policy benefit liabilities of life and health insurance contracts are designated as held-for-trading securities using the fair value option. Under United States GAAP , liabilities for life insurance... -
Page 169
...the cost (benefit) of plan amendments are recorded in Accumulated Other Comprehensive (Income) Loss. Under Canadian GAAP , these amounts are recorded in our Consolidated Balance Sheet in other assets or other liabilities. There is no change in the calculation of the pension and other employee future... -
Page 170
...the purchase. (q) Software Development Costs Under United States GAAP , costs of internally developed software are required to be capitalized and amortized over the expected useful life of the software. Under Canadian GAAP , prior to November 1, 2003, 168 BMO Financial Group 193rd Annual Report 2010... -
Page 171
... BMO Private Equity (Canada) Inc. BMO Nesbitt Burns Employee Co-Investment Fund I Management (Canada) Inc. and subsidiaries BMO Trust Company BMO (US) Credit Corp. Clark Street Holdings, LLC BMO (US) Lending, LLC Harris Financial Corp. BMO Capital Markets Corp. BMO Capital Markets Equity Group... -
Page 172
...earnings on assets, such as loans and securities, including interest and dividend income and BMO's share of income from investments accounted for using the equity method of accounting, less interest expense paid on liabilities, such as deposits. P 37 170 BMO Financial Group 193rd Annual Report 2010 -
Page 173
... to market on a daily basis. Trading revenues include income (expense) and gains (losses) from both cash instruments and interest rate, foreign exchange (including spot positions), equity, commodity and credit contracts. P 39 Productivity Ratio (or Expense-toRevenue Ratio or Efficiency Ratio) is... -
Page 174
... Bank of Montreal are listed on the Toronto Stock Exchange. Credit Ratings Credit rating information appears on page 25 of this annual report and on our website. www.bmo.com/creditratings Total volume of shares traded Common Share Trading in Fiscal 2010 Primary stock exchanges Ticker Closing price... -
Page 175
... domestic companies under New York Stock Exchange Listing Standards is posted on our website. For all other shareholder inquiries: Shareholder Services BMO Financial Group, Corporate Secretary's Department 21st Floor, 1 First Canadian Place, Toronto, ON M5X 1A1 Email: [email protected] Call... -
Page 176
... trademarks of Bank of Montreal or its subsidiaries: BMO, BMO and the M-bar roundel symbol, BMO Asset Management, BMO BOaTS, BMO Capital Markets, BMO Elite, BMO MoneyLogic, BMO SmartSteps, Encircle, FirstHome, Harris Private Bank, Helpful Steps, InvestorLine, Making Money Make Sense, Nesbitt Burns...