Bank of Montreal 2004 Annual Report Download - page 2
Download and view the complete annual report
Please find page 2 of the 2004 Bank of Montreal annual report below. You can navigate through the pages in the report by either clicking on the pages listed below, or by using the keyword search tool below to find specific information within the annual report.-
 1
1 -
 2
2 -
 3
3 -
 4
4 -
 5
5 -
 6
6 -
 7
7 -
 8
8 -
 9
9 -
 10
10 -
 11
11 -
 12
12 -
 13
13 -
14
-
15
-
16
-
17
-
18
-
19
-
20
-
21
-
22
-
23
-
24
-
25
-
26
-
27
-
28
-
29
-
30
-
31
-
32
-
33
-
34
-
35
-
36
-
37
-
38
-
39
-
40
-
41
-
42
-
43
-
44
-
45
-
46
-
47
-
48
-
49
-
50
-
51
-
52
-
53
-
54
-
55
-
56
-
57
-
58
-
59
-
60
-
61
-
62
-
63
-
64
-
65
-
66
-
67
-
68
-
69
-
70
-
71
-
72
-
73
-
74
-
75
-
76
-
77
-
78
-
79
-
80
-
81
-
82
-
83
-
84
-
85
-
86
-
87
-
88
-
89
-
90
-
91
-
92
-
93
-
94
-
95
-
96
-
97
-
98
-
99
-
100
-
101
-
102
-
103
-
104
-
105
-
106
-
107
-
108
-
109
-
110
-
111
-
112
-
113
-
114
-
115
-
116
-
117
-
118
-
119
-
120
-
121
-
122
-
123
-
124
-
125
-
126
-
127
-
128
-
129
-
130
-
131
-
132
-
133
-
134
 |
 |

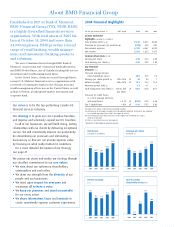
Established in 1817 as Bank of Montreal,
BMO®Financial Group (TSX, NYSE: BMO)
is a highly diversified financial services
organization. With total assets of $265 bil-
lion at October 31, 2004 and more than
34,000 employees, BMO provides a broad
range of retail banking, wealth manage-
ment and investment banking products
and solutions.
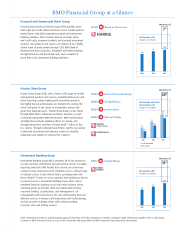
We serve Canadian clients through BMO Bank of
Montreal, our personal and commercial banking business,
and BMO Nesbitt Burns, one of Canada’s leading full-service
investment and wealth management firms.
In the United States, clients are served through Harris,
a major U.S. Midwest financial services organization with
a network of community banks in the Chicago area and
wealth management offices across the United States, as well
as Harris Nesbitt, a leading mid-market investment and
corporate bank.
Trim this area
About BMO Financial Group
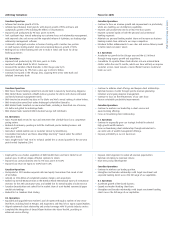
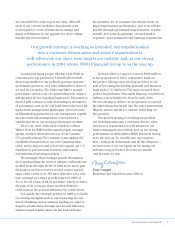
Our vision is to be the top-performing Canada-U.S.
financial services company.
Our strategy is to grow our core Canadian franchise,
and improve and selectively expand our U.S. franchise.
In all of our businesses, we will build strong, lasting
relationships with our clients by delivering exceptional
service. We will consistently improve our productivity
by streamlining our processes and eliminating
bureaucracy so that we can provide superior value
by focusing on what really matters to customers.
For a more detailed description of our strategy,
see page 21.
We pursue our vision and realize our strategy through
our steadfast commitment to our core values
:
•We
care
about our customers, shareholders,
communities and each other.
•We draw our strength from the
diversity
of our
people and our businesses.
•
We insist upon respect for everyone and
encourage all to have a voice.
•We
keep our promises
and
stand accountable
for our every action.
•We share information, learn and innovate to
create consistently superior customer experiences.
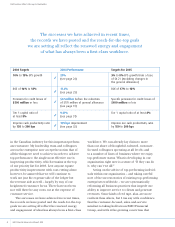
For the year ended October 31 2004 Target 2004 2003 2002
Income Statement
Highlights (Canadian $ in millions)
Total revenue (teb) (a) (c) 9,612 9,271 8,859
Provision for (recovery of) credit losses (103) 455 820
Non-interest expense 6,157 6,087 6,030
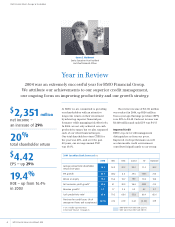
Net income 2,351 1,825 1,417
Common Share Data ($) (b)
Earnings per share 4.42 3.44 2.68
Cash earnings per share (c) 4.57 3.59 2.83
Key Financial
Measures (%)
Five-year average annual
total shareholder return 18.9 12.9 7.9
Earnings per share growth (b) 10%
–
15% ✔29 28 1
Return on equity 16%
–
18% ✔19.4 16.4 13.4
Revenue growth (teb) (c) 3.7 4.7
–
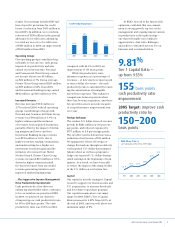
Cash productivity ratio (teb) (c) 150 to 200 ✔63.0 64.5 67.1
bps lower
Provision for credit losses
as a % of average net loans
and acceptances ≤ 0.32* ✔(0.07) 0.30 0.56
Tier 1 Capital Ratio ≥ 8% ✔9.81 9.55 8.80
All ratios in this report are based on unrounded numbers.
(a) All revenues in this report, except in the Consolidated Financial Statements, are reported
on a taxable equivalent basis (teb). See pages 26 and 28.
(b) All earnings per share (EPS) measures in this report refer to diluted EPS, unless
otherwise specified.
(c) This is a non-GAAP measure. See page 26.
*Represents $500 million of specific provisions.
2004 Financial Highlights
20042003200220012000
Net Income
(Canadian $ in millions)
1,857
1,471 1,417
1,825
2,351
20042003200220012000
Earnings per Share
(Canadian $)
3.25
2.66 2.68
3.44
4.42
20042003200220012000
Return on Equity
(%)
18.0
13.8 13.4
16.4
19.4
20042003200220012000
One-Year Total
Shareholder Return (%)
29.0
(1.2)
16.2
33.4
20.0