Banana Republic 2005 Annual Report Download - page 17
Download and view the complete annual report
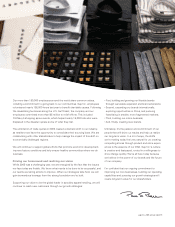
Please find page 17 of the 2005 Banana Republic annual report below. You can navigate through the pages in the report by either clicking on the pages listed below, or by using the keyword search tool below to find specific information within the annual report.-
 1
1 -
2
-
3
-
4
-
5
-
6
-
 7
7 -
 8
8 -
 9
9 -
 10
10 -
 11
11 -
 12
12 -
 13
13 -
 14
14 -
 15
15 -
 16
16 -
 17
17 -
 18
18 -
 19
19 -
 20
20 -
 21
21 -
 22
22 -
 23
23 -
 24
24 -
 25
25 -
 26
26 -
 27
27 -
28
-
29
-
30
-
31
-
32
-
33
-
34
-
35
-
36
-
37
-
38
-
39
-
40
-
41
-
42
-
43
-
44
-
45
-
46
-
47
-
48
-
49
-
50
-
51
-
52
-
53
-
54
-
55
-
56
-
57
-
58
-
59
-
60
-
61
-
62
-
63
-
64
-
65
-
66
-
67
-
68
 |
 |

G A P I N C . F I N A N C I A L S 2 0 0 5
gap inc. 2005 annual report 15
FIVE-YEAR SELECTED DATA
The following selected financial data are derived from the Consolidated Financial Statements of Gap Inc. (the “Company”). The data set forth below
should be read in conjunction with “Management’s Discussion and Analysis of Financial Condition and Results of Operations” and the Company’s
Consolidated Financial Statements and notes herein.
Fiscal Year (in weeks)
2005 (52) 2004 (52) 2003 (52) 2002 (52) 2001 (52)
Operating Results ($ in millions)
Net sales $ 16,023 $ 16,267 $ 15,854 $ 14,455 $ 13,848
Cost of goods sold and occupancy expenses 10,154 9,886 9,885 9,541 9,733
Gross margin 36.6% 39.2% 37.6% 34.0% 29.7%
Operating expenses, excluding loss on early retirement of debt $ 4,124 $ 4,296 $ 4,068 $ 3,901 $ 3,806
Loss on early retirement of debt - 105 21 - -
Operating margin (a) 10.9% 12.2% 11.9% 7.0% 2.2%
Net interest (income) expense (b) $ (48) $ 108 $ 196 $ 212 $ 96
Earnings before income taxes 1,793 1,872 1,684 801 213
Percentage of net sales 11.2% 11.5% 10.6% 5.5% 1.5%
Income taxes $ 680 $ 722 $ 653 $ 323 $ 238
Net earnings (loss) 1,113 1,150 1,031 478 (25)
Percentage of net sales 6.9% 7.1% 6.5% 3.3% (0.2%)
Cash dividends paid $ 179 $ 79 $ 79 $ 78 $ 76
Purchase of property and equipment 600 419 261 308 1,026
Depreciation and amortization 625 615 675 706 741
Per Share Data
Net earnings (loss)-basic $ 1.26 $ 1.29 $ 1.15 $ 0.55 $ (0.03)
Net earnings (loss)-diluted 1.24 1.21 1.09 0.54 (0.03)
Dividends paid (c) 0.18 0.09 0.09 0.09 0.09
Shareholders equity (book value) 6.16 5.53 5.21 4.03 3.35
Financial Position ($ in millions, except per square foot data)
Property and equipment, net $ 3,246 $ 3,376 $ 3,626 $ 4,069 $ 4,487
Merchandise inventory 1,696 1,814 1,704 2,048 1,769
Total assets 8,821 10,048 10,713 10,283 8,096
Inventory per square foot (d) 43 48 45 53 47
Inventory per square foot (decrease) increase (11%) 6.2% (15.5%) 13.5% (20.3%)
Working capital $ 3,297 $ 4,062 $ 4,156 $ 2,972 $ 1,018
Current ratio 2.70:1 2.81:1 2.63:1 2.08:1 1.48:1
Total long-term debt and senior convertible notes,
less current maturities (b) $ 513 $ 1,886 $ 2,487 $ 2,896 $ 1,961
Ratio of long-term debt and senior convertible notes
to shareholders’ equity (e) 0.09:1 0.38:1 0.54:1 0.82:1 0.68:1
Shareholders’ equity $ 5,425 $ 4,936 $ 4,648 $ 3,526 $ 2,880
Return on average assets 11.8% 11.1% 9.8% 5.2% (0.3%)
Return on average shareholders’ equity 21.5% 24.0% 25.2% 14.9% (0.9%)
Statistics
Number of new store locations opened 198 130 35 115 324
Number of store locations closed 139 158 130 95 75
Number of store locations open at year-end 3,053 2,994 3,022 3,117 3,097
Net increase (decrease) in number of store locations 2% (1%) (3%) 1% 9%
Comparable store sales increase (decrease) percentage (52-week basis) (5%) 0% 7% (3%) (13%)
Sales per square foot (52-week basis) (f) $ 412 $ 428 $ 415 $ 378 $ 394
Square footage of store space at year-end 37,765,229 36,590,929 36,518,204 37,251,520 36,333,392
Percentage increase (decrease) in square feet 3% 0% (2%) 3% 16%
Number of employees at year-end 153,000 152,000 153,000 169,000 165,000
Weighted-average number of shares-basic 881,057,753 893,356,815 892,554,538 875,545,551 860,255,419
Weighted-average number of shares-diluted 902,305,691 991,121,573 988,177,828 881,477,888 860,255,419
Number of shares outstanding at year-end, net of treasury stock 856,985,979 860,559,077 897,202,485 887,322,707 865,726,890
(a) Operating margin includes loss on early retirement of debt.
(b) Fiscal 2005 reduction due primarily to the March 2005 redemption of our Senior Convertible Notes. See Note B to the Consolidated Financial Statements.
(c) Fiscal 2005 dividend per share does not include a dividend of $.0222 per share declared in the fourth quarter of fiscal 2004 but paid in the first quarter of fiscal 2005.
(d) Based on year-end store square footage and inventory balances; excludes inventory related to online sales.
(e) Long-term debt includes current maturities.
(f) Based on monthly average store square footage.