BT 2006 Annual Report Download - page 4
Download and view the complete annual report
Please find page 4 of the 2006 BT annual report below. You can navigate through the pages in the report by either clicking on the pages listed below, or by using the keyword search tool below to find specific information within the annual report.-
 1
1 -
 2
2 -
 3
3 -
 4
4 -
 5
5 -
 6
6 -
 7
7 -
 8
8 -
 9
9 -
 10
10 -
 11
11 -
 12
12 -
 13
13 -
 14
14 -
 15
15 -
16
-
17
-
18
-
19
-
20
-
21
-
22
-
23
-
24
-
25
-
26
-
27
-
28
-
29
-
30
-
31
-
32
-
33
-
34
-
35
-
36
-
37
-
38
-
39
-
40
-
41
-
42
-
43
-
44
-
45
-
46
-
47
-
48
-
49
-
50
-
51
-
52
-
53
-
54
-
55
-
56
-
57
-
58
-
59
-
60
-
61
-
62
-
63
-
64
-
65
-
66
-
67
-
68
-
69
-
70
-
71
-
72
-
73
-
74
-
75
-
76
-
77
-
78
-
79
-
80
-
81
-
82
-
83
-
84
-
85
-
86
-
87
-
88
-
89
-
90
-
91
-
92
-
93
-
94
-
95
-
96
-
97
-
98
-
99
-
100
-
101
-
102
-
103
-
104
-
105
-
106
-
107
-
108
-
109
-
110
-
111
-
112
-
113
-
114
-
115
-
116
-
117
-
118
-
119
-
120
-
121
-
122
-
123
-
124
-
125
-
126
-
127
-
128
-
129
-
130
-
131
-
132
-
133
-
134
-
135
-
136
-
137
-
138
-
139
-
140
-
141
-
142
-
143
-
144
-
145
-
146
-
147
-
148
-
149
-
150
 |
 |

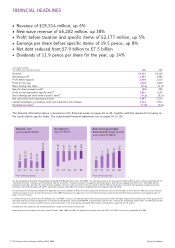
sRevenue of £19,514 million, up 6%
sNew wave revenue of £6,282 million, up 38%
sProfit before taxation and specific items
a
of £2,177 million, up 5%
sEarnings per share before specific items
a
of 19.5 pence, up 8%
sNet debt reduced from £7.9 billion to £7.5 billion
sDividends of 11.9 pence per share for the year, up 14%
Year ended 31 March
In £ million unless otherwise stated 2006 2005
Revenue 19,514 18,429
Operating profit 2,495 2,992
Profit before taxation 2,040 2,354
Profit for the year 1,548 1,829
Basic earnings per share 18.4p 21.5p
Specific items (charge) credit
a
(96) 290
Profit for the year before specific items
a
1,644 1,539
Basic earnings per share before specific items
a
19.5p 18.1p
Net cash inflow from operating activities 5,387 5,574
Capital expenditure on property, plant and equipment and software 3,142 3,011
Dividends per share
b
11.9p 10.4p
The financial information above is discussed in the Financial review on pages 26 to 39, together with the reasons for focusing on
the results before specific items. The consolidated financial statements are on pages 64 to 122.
Revenue1 (£m)
years ended 31 March
18,447
18,727
18,519
18,429
19,514
1 From continuing activities
060504
c
03
c
02
c
Net debt (£m)
as at 31 Marcha
7,534
7,893
8,425
9,573
13,701
060504
c
03
c
02
c
Basic earnings per share
before specific items1 (pence)
years ended 31 Marcha
9.0
14.4
16.9
18.1
19.5
1 From continuing activities
060504
c
03
c
02
c
The group adopted International Financial Reporting Standards (IFRS) with effect from 1 April 2005. The comparative data for the year ended 31 March 2005 has been restated accordingly. IAS 32,
‘Financial Instruments: Disclosure and Presentation’ (IAS 32) and IAS 39, ‘Financial Instruments: Recognition and Measurement’ (IAS 39) were adopted with effect from 1 April 2005 and the
comparative data does not reflect the effect of these standards. Amounts in the years prior to the year ended 31 March 2005 are presented in accordance with generally accepted accounting
principles in the United Kingdom (UK GAAP). Information prepared under IFRS is not directly comparable with that prepared under UK GAAP.
For the purposes of US reporting requirements applicable to first time adopters of IFRS, BT hereby incorporates by reference from its Annual report on Form 20-F for 2005 the five year financial
summary on pages 23 to 24 thereof, the discussion of the 2005 financial year on pages 26 to 143 in the Financial review section thereof and the Financial statements and supporting notes on
pages 72 to 122 thereof.
aA number of measures quoted in this Annual Report are ‘non-GAAP’ measures. The directors believe these measures provide a more meaningful analysis of the trading results of the group and are
consistent with the way financial performance is measured by management. These include EBITDA and profit before specific items, earnings per share before specific items, net debt and free cash
flow. The rationale for using non-GAAP measures and reconciliations to the most directly comparable IFRS indicator are provided on pages 28, 65, 83 and 84.
bDividends per share represents the dividend proposed in respect of the relevant financial year.
cAmounts presented in respect of the years ended 31 March 2004, 2003 and 2002 are prepared in accordance with UK GAAP. UK GAAP is not directly comparable with IFRS.
FINANCIAL HEADLINES
BT Group plc Annual Report and Form 20-F 2006 Financial headlines2