BT 1997 Annual Report Download - page 15
Download and view the complete annual report
Please find page 15 of the 1997 BT annual report below. You can navigate through the pages in the report by either clicking on the pages listed below, or by using the keyword search tool below to find specific information within the annual report.-
 1
1 -
2
-
3
-
4
-
 5
5 -
 6
6 -
 7
7 -
 8
8 -
 9
9 -
 10
10 -
 11
11 -
 12
12 -
 13
13 -
 14
14 -
 15
15 -
 16
16 -
 17
17 -
 18
18 -
 19
19 -
 20
20 -
 21
21 -
 22
22 -
 23
23 -
 24
24 -
 25
25 -
26
-
27
-
28
-
29
-
30
-
31
-
32
-
33
-
34
-
35
-
36
-
37
-
38
-
39
-
40
-
41
-
42
-
43
-
44
-
45
-
46
-
47
-
48
-
49
-
50
-
51
-
52
-
53
-
54
-
55
-
56
-
57
-
58
-
59
-
60
-
61
-
62
-
63
-
64
-
65
-
66
-
67
-
68
-
69
-
70
-
71
-
72
 |
 |

FINANCIAL REVIEW
15
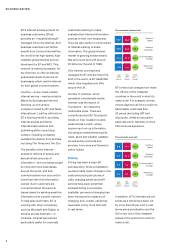
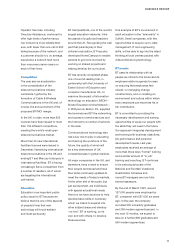
Cellnet customers
(millions)
0.7
1.0
1.7
2.4
2.7
93 94 95 96 97
Employees (thousands)
170.7
156.0
137.5
130.7
127.5
93 94 95 96 97
Private circuit turnover rose by 6.4% with the demand for
KiloStream and MegaStream services continuing at a
high level.
Mobile communications turnover increased by 10.9% in
the year to £949 million, reflecting the 12.9% growth in
Cellnet’s customer base, offset by the effect of substantial
reductions in mobile call prices. Cellnet had 2.7 million
customer connections, of which over 1.1 million were
digital, at 31 March 1997.
BT’s expanding overseas operations in Continental
Europe, including the group’s systems integration
business and the sales of advanced and managed
network services, were the main elements behind
the growth of 23.5% in other sales and services.
Concert Communications’ services were in increasing
demand with turnover rising rapidly. The acquisition
of a business based in the Netherlands in April 1996
largely contributed to the growth in systems
integration turnover.
Operating costs
Total operating costs increased by 3.0% in the year. As a
percentage of turnover, operating costs decreased from
78.5% in the previous financial year to 78.3%.
1997 1996 Change
£m £m %
Staff costs 3,778 3,680 2.7
Own work capitalised (399) (417) (4.3)
Depreciation 2,265 2,189 3.5
Payments to
telecommunication
operators 1,476 1,383 6.7
Other operating costs 4,309 4,193 2.8
Other operating income (106) (103) 2.9
Total operating costs,
before redundancy
charges 11,323 10,925 3.6
Redundancy charges 367 421 (12.8)
Total operating costs 11,690 11,346 3.0
Staff costs increased by 2.7% as a result of the effects
of the annual pay awards, acquired subsidiaries, and
a higher allocation for the employee share ownership
scheme, offset by savings resulting from the continuing
staff reductions.
There was a 3,200 net reduction in group staff
numbers in the year with over 5,500 people leaving under
early release terms. This reduction is a substantially
lower figure than in recent years.