BT 1997 Annual Report Download - page 1
Download and view the complete annual report
Please find page 1 of the 1997 BT annual report below. You can navigate through the pages in the report by either clicking on the pages listed below, or by using the keyword search tool below to find specific information within the annual report.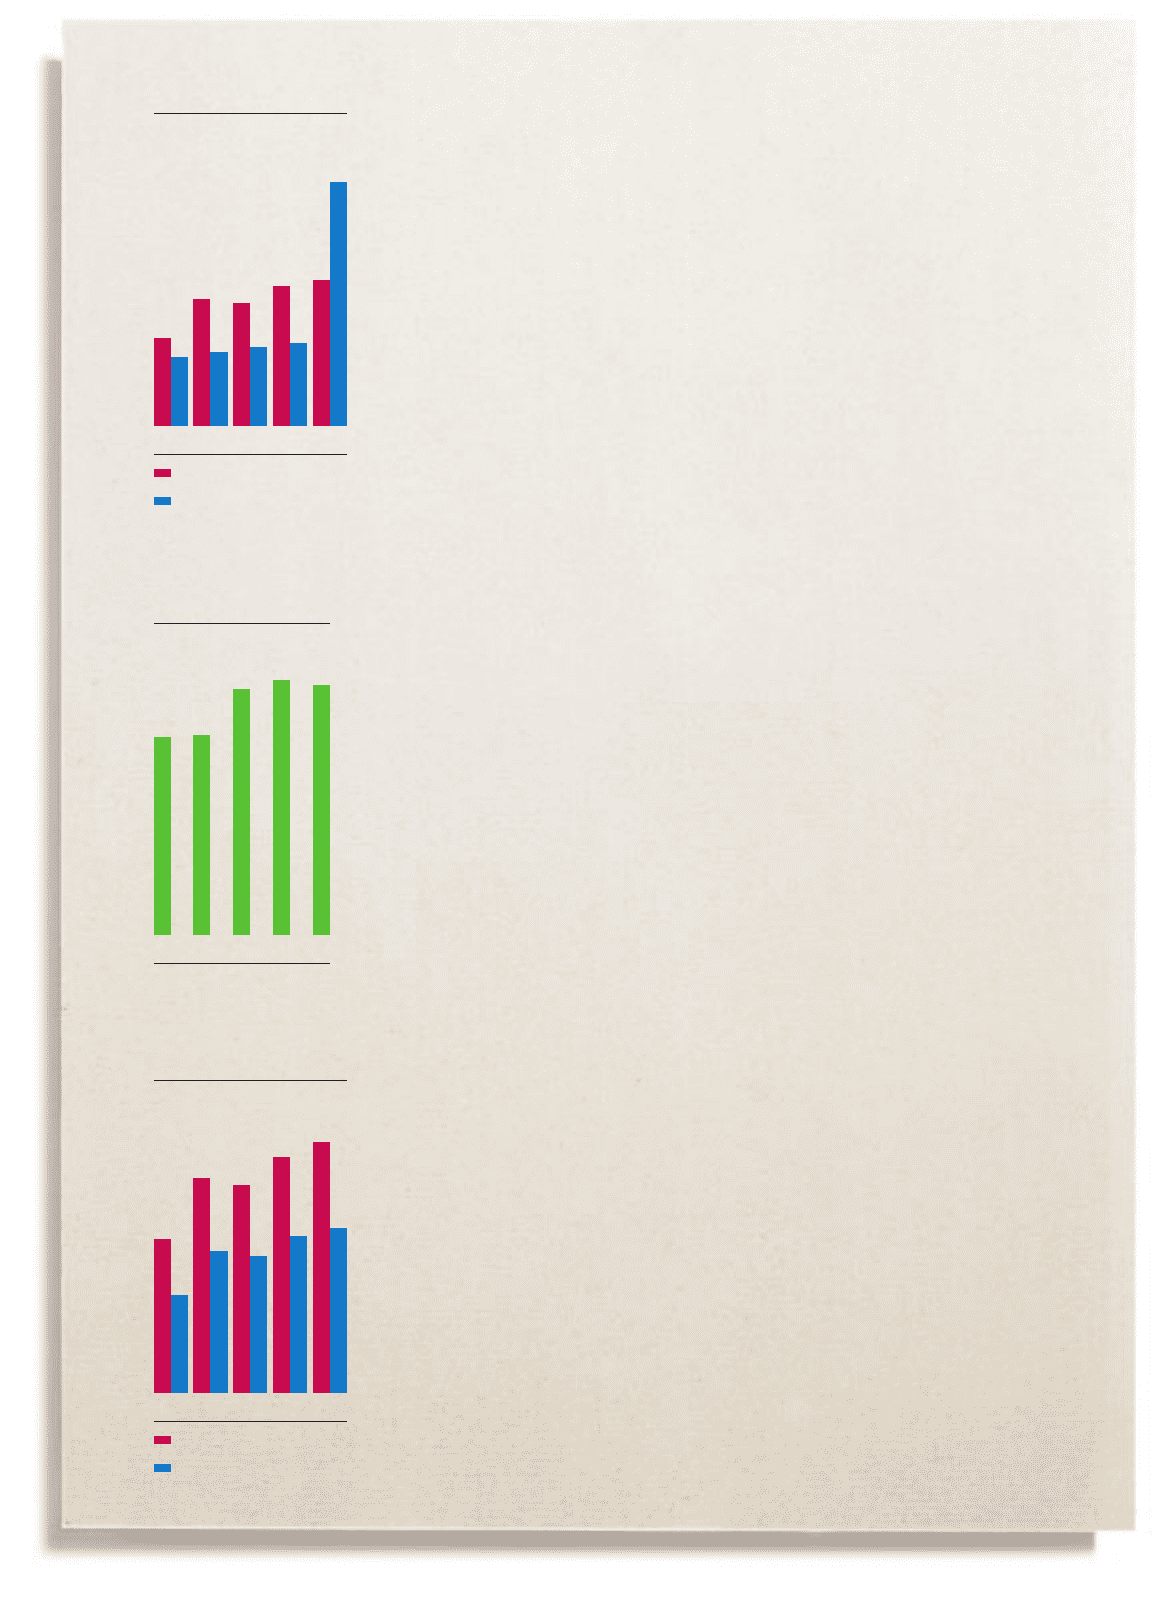
1
Contents
2Chairman’s statement
4An interview with Chief Executive, Sir Peter Bonfield
6Business review
13 Financial review
21 Report of the directors
22 Board of directors
24 Corporate governance
26 Auditors’ report on corporate governance matters
27 Report of the Board Committee on Executive Remuneration
34 Statement of directors’ responsibility
34 Report of the auditors
35 Five year financial summary
36 Accounting policies
38 Consolidated financial statements
61 Subsidiary and associated undertakings
63 Quarterly analysis of turnover and profit
64 Financial statistics
65 Operational statistics
66 Regulatory statistics and information
67 United States Generally Accepted Accounting
Principles reconciliations
69 Additional information for shareholders
72 Index
3Proposed merger with MCI announced to form group
with annual turnover of around £26 billion
3Prices reduced by over £800 million in the year
3Strategic alliances and joint ventures in Europe and
Asia announced or completed in year
3Operating cash flow grew by 6 per cent to £6.2 billion
3Capital expenditure maintained at over £2.7 billion
36.1 per cent increase in ordinary dividends per share
with a special dividend of 35 pence per share
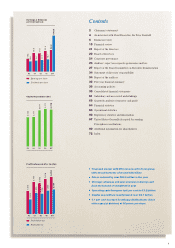
Earnings & dividends
per share (pence)
19.8
15.6
28.5
16.7
27.8
17.7
31.6
18.7
32.8
54.85
93 94 95 96 97
Earnings per share
Dividends per share
Capital expenditure (£m)
2,155
2,171
2,671
2,771
2,719
93 94 95 96 97
Profit before and after tax (£m)
1,972
1,248
2,756
1,805
2,662
1,736
3,019
1,992
3,203
2,101
93 94 95 96 97
Profit before tax
Profit after tax

