Amgen 2011 Annual Report Download - page 2
Download and view the complete annual report
Please find page 2 of the 2011 Amgen annual report below. You can navigate through the pages in the report by either clicking on the pages listed below, or by using the keyword search tool below to find specific information within the annual report.-
 1
1 -
 2
2 -
 3
3 -
 4
4 -
 5
5 -
 6
6 -
 7
7 -
 8
8 -
 9
9 -
 10
10 -
 11
11 -
 12
12 -
 13
13 -
14
-
15
-
16
-
17
-
18
-
19
-
20
-
21
-
22
-
23
-
24
-
25
-
26
-
27
-
28
-
29
-
30
-
31
-
32
-
33
-
34
-
35
-
36
-
37
-
38
-
39
-
40
-
41
-
42
-
43
-
44
-
45
-
46
-
47
-
48
-
49
-
50
-
51
-
52
-
53
-
54
-
55
-
56
-
57
-
58
-
59
-
60
-
61
-
62
-
63
-
64
-
65
-
66
-
67
-
68
-
69
-
70
-
71
-
72
-
73
-
74
-
75
-
76
-
77
-
78
-
79
-
80
-
81
-
82
-
83
-
84
-
85
-
86
-
87
-
88
-
89
-
90
-
91
-
92
-
93
-
94
-
95
-
96
-
97
-
98
-
99
-
100
-
101
-
102
-
103
-
104
-
105
-
106
-
107
-
108
-
109
-
110
-
111
-
112
-
113
-
114
-
115
-
116
-
117
-
118
-
119
-
120
-
121
-
122
-
123
-
124
-
125
-
126
-
127
-
128
-
129
-
130
-
131
-
132
-
133
-
134
-
135
-
136
-
137
-
138
-
139
-
140
-
141
-
142
-
143
-
144
-
145
-
146
-
147
-
148
-
149
-
150
-
151
-
152
-
153
-
154
-
155
-
156
-
157
-
158
-
159
-
160
-
161
-
162
-
163
-
164
-
165
-
166
-
167
-
168
-
169
-
170
-
171
-
172
-
173
-
174
-
175
-
176
-
177
-
178
-
179
-
180
-
181
-
182
-
183
-
184
 |
 |

* “Adjusted” earnings per share and “adjusted” R&D expenses are non-GAAP fi nancial measures. See page 12 for reconciliations to U.S. generally accepted accounting principles (GAAP).
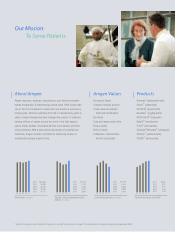
Our Mission:
To Serve Patients
ProductsAmgen ValuesAbout Amgen
Total revenues ($ in millions)
2011 $15,582
2010 15,053
2009 14,642
2008 15,003
2007 14,771
07 08 09 10 11
“Adjusted” earnings per share (EPS)*
07 08 09 10 11
2011 $5.33
2010 5.21
2009 4.91
2008 4.55
2007 4.29
07 08 09 10 11
2011 $5,119
2010 5,787
2009 6,336
2008 5,988
2007 5,401
Cash fl ow from operations ($ in millions)
“Adjusted” research and development (R&D)
expenses* ($ in millions)
07 08 09 10 11
2011 $3,116
2010 2,773
2009 2,739
2008 2,910
2007 3,064
Aranesp® (darbepoetin alfa)
Enbrel® (etanercept)
EPOGEN® (epoetin alfa)
Neulasta® (pegfi lgrastim)
NEUPOGEN® (Filgrastim)
Nplate® (romiplostim)
Prolia® (denosumab)
Sensipar®/Mimpara® (cinacalcet)
Vectibix® (panitumumab)
XGEVA® (denosumab)
Be science-based
Compete intensely and win
Create value for patients,
staff, and stockholders
Be ethical
Trust and respect each other
Ensure quality
Work in teams
Collaborate, communicate,
and be accountable
Amgen discovers, develops, manufactures, and delivers innovative
human therapeutics. A biotechnology pioneer since 1980, Amgen was
one of the first companies to realize the new science’s promise by
bringing safe, effective medicines from lab to manufacturing plant to
patient. Amgen therapeutics have changed the practice of medicine,
helping millions of people around the world in the fight against
cancer, kidney disease, rheumatoid arthritis, bone disease, and other
serious illnesses. With a deep and broad pipeline of potential new
medicines, Amgen remains committed to advancing science to
dramatically improve people’s lives.