American Express 2005 Annual Report Download - page 28
Download and view the complete annual report
Please find page 28 of the 2005 American Express annual report below. You can navigate through the pages in the report by either clicking on the pages listed below, or by using the keyword search tool below to find specific information within the annual report.-
 1
1 -
2
-
3
-
4
-
5
-
6
-
7
-
8
-
9
-
10
-
11
-
12
-
13
-
14
-
15
-
16
-
17
-
 18
18 -
 19
19 -
 20
20 -
 21
21 -
 22
22 -
 23
23 -
 24
24 -
 25
25 -
 26
26 -
 27
27 -
 28
28 -
 29
29 -
 30
30 -
 31
31 -
 32
32 -
 33
33 -
 34
34 -
 35
35 -
 36
36 -
 37
37 -
 38
38 -
39
-
40
-
41
-
42
-
43
-
44
-
45
-
46
-
47
-
48
-
49
-
50
-
51
-
52
-
53
-
54
-
55
-
56
-
57
-
58
-
59
-
60
-
61
-
62
-
63
-
64
-
65
-
66
-
67
-
68
-
69
-
70
-
71
-
72
-
73
-
74
-
75
-
76
-
77
-
78
-
79
-
80
-
81
-
82
-
83
-
84
-
85
-
86
-
87
-
88
-
89
-
90
-
91
-
92
-
93
-
94
-
95
-
96
-
97
-
98
-
99
-
100
-
101
-
102
-
103
-
104
-
105
-
106
 |
 |

Overall, it is management’s priority to increase
shareholder value over the moderate to long-term by
achieving the following long-term financial targets, on
average and over time:
®Earnings per share growth of 12 to 15 percent;
®Revenue growth of at least 8 percent; and
®Return on shareholders’ equity of 28 to 30 percent (18
to 20 percent prior to the Ameriprise spin-off).
During 2005, the Company met or exceeded its earnings
per share, revenue and return on equity targets, illustrat-
ing the benefits of the strong business momentum
achieved through the business-building investments
made over the past few years. After the completion of
the Ameriprise spin-off in 2005, the Company raised its
return on equity target from 18 to 20 percent to 28 to
30 percent. Reported return on shareholders’ equity for
2005 was 25 percent which exceeded our target prior
to the spin-off and which is calculated on a trailing
12-month basis using reported net income over average
total shareholders’ equity including discontinued opera-
tions (prior to disposal).
Pro forma return on shareholders’ equity, determined
using income from continuing operations over the
average of the month-end shareholders’ equity at
September 30, 2005 through December 31, 2005, was
31 percent. Management believes pro forma return on
shareholders’ equity is a better comparison to the 28–30
percent target post spin-off as the earnings and capital
from discontinued operations reflected in the calcula-
tion of reported return on shareholders’ equity are not
included in the 28–30 percent target.
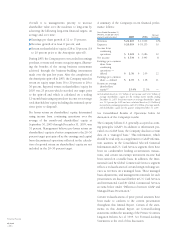
A summary of the Company’s recent financial perfor-
mance follows:
Years Ended December 31,
(Millions, except per share
amounts and ratio data) 2005 2004 Percent
Increase
Revenues $ 24,267 $ 21,964 10%
Expenses $ 20,019 $ 18,133 10
Income from
continuing
operations $ 3,221 $ 2,686 20
Net income $ 3,734 $ 3,445 8
Earnings per common
share from
continuing
operations —
diluted $ 2.56 $ 2.09 22
Earnings per common
share — diluted $ 2.97 $ 2.68 11
Return on average
shareholders’
equity
(a)
25.4% 22.0% —
(a)Calculated based on $3.7 billion of net income and $14.7 billion of
average shareholders’ equity for the trailing twelve months ending
December 31, 2005. Pro forma return on average shareholders’ equity
was 31.5 percent for 2005 and was calculated based on $3.2 billion of
income from continuing operations and $10.2 billion of average month-
end shareholders’ equity for the quarter ending December 31, 2005.
See Consolidated Results of Operations below for
discussion of the Company’s results.
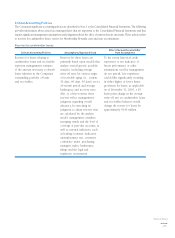
The Company follows U.S. generally accepted account-
ing principles (GAAP). In addition to information pro-
vided on a GAAP basis, the Company discloses certain
data on a “managed basis.” This information, which
should be read only as a supplement to GAAP informa-
tion, assumes, in the Consolidated Selected Statistical
Information and U.S. Card Services segment, there have
been no cardmember lending securitization transac-
tions, and certain tax-exempt investment income had
been earned on a taxable basis. In addition, the Inter-
national Card & Global Commercial Services segment
reflects a reclassification of certain foreign exchange ser-
vices as revenues on a managed basis. These managed
basis adjustments, and management’s rationale for such
presentation, are discussed further in U.S. Card Services
and International Card & Global Commercial Services
sections below under “Differences between GAAP and
Managed Basis Presentation.”
Certain reclassifications of prior period amounts have
been made to conform to the current presentation
throughout this Annual Report. Certain of the state-
ments in this Annual Report are forward-looking
statements within the meaning of the Private Securities
Litigation Reform Act of 1995. See Forward-Looking
Statements at the end of this discussion.
Financial Review
AXP / AR.2005
[26 ]