Alpine 2011 Annual Report Download - page 12
Download and view the complete annual report
Please find page 12 of the 2011 Alpine annual report below. You can navigate through the pages in the report by either clicking on the pages listed below, or by using the keyword search tool below to find specific information within the annual report.-
 1
1 -
 2
2 -
 3
3 -
 4
4 -
 5
5 -
 6
6 -
 7
7 -
 8
8 -
 9
9 -
 10
10 -
 11
11 -
 12
12 -
 13
13 -
 14
14 -
 15
15 -
 16
16 -
 17
17 -
 18
18 -
 19
19 -
 20
20 -
 21
21 -
 22
22 -
23
-
24
-
25
-
26
-
27
-
28
-
29
-
30
-
31
-
32
-
33
-
34
-
35
-
36
-
37
-
38
 |
 |

12
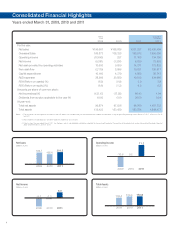
Millions of Yen,unless stated otherwise
2001 2002 2003 2004 2005 2006
For the year:
Net sales 181,615 196,092 222,367 213,020 222,779 253,983
(Overseas Sales) 129,522 157,032 177,017 170,984 180,828 215,281
Operating income(loss) 4,445 7,022 12,306 11,320 10,148 9,671
Net income(loss) 3,284 3,914 6,138 7,253 7,932 6,175
Comprehensive income – – – – – –
Net cash provided by
operating activities 1,921 15,728 14,389 10,491 12,472 12,887
Free cash flow (3,602) 8,513 6,290 3,021 3,229 3,032
Depreciation 5,385 5,552 5,723 6,496 7,332 8,616
Capital expenditures 6,307 6,808 8,218 8,940 10,402 10,778
R&D expenses 12,628 14,718 17,644 19,144 22,438 28,695
ROA (Return on assets) (%) 2.7 2.8 4.1 4.9 5.3 3.8
ROE (Return on equity) (%) 5.4 5.6 8.3 9.4 9.4 6.2
At year-end:
Current assets 85,046 102,396 106,180 99,031 105,372 109,910
Total Property, plant and equipment
23,649 22,466 22,898 22,714 25,544 27,647
Current liabilities 53,094 55,754 58,669 48,681 50,826 52,173
Noncurrent liabilities 6,403 17,944 15,869 15,534 15,807 5,004
Capital stock 19,928 19,928 20,012 20,026 20,360 25,921
Retained earnings 26,002 29,247 34,393 40,500 47,275 52,213
Total shareholders' equity 67,145 72,467 74,738 80,336 88,830 110,782
Total net assets – – – – – –
Total assets 127,772 147,412 150,230 145,127 156,507 169,553
Equity ratio (%) 52.6 49.2 49.8 55.4 56.7 65.3
Amounts per share of common stock:
Net income(loss) (¥) 56.40 64.49 99.78 117.94 128.97 91.71
Diluted net income (¥) 54.60 – 86.86 102.85 112.58 88.35
Dividends from surplus
applicable to the year (¥) 10.00 12.50 17.50 17.50 20.00 20.00
Shareholders' equity (¥) 1,106.38 1,194.19 1,227.79 1,319.41 1,446.99 1,587.05
Notes: 1. R&D expenses include labor and other expenses reported as cost of sales.
2. Effective from the year ended March 31, 2007, the Company and its consolidated subsidiaries adopted the new accounting standard for presentation
of net assets
("Accounting Standard for Presentation of Net Assets in the Balance Sheet and its Implementation Guidance" issued by the Business Accounting
Deliberation Council on December 9, 2005).
3. Effective from the year ended March, 2011, the Company and its consolidated subsidiaries adopted the Accounting Standard of Presenation of
Comprehensive income (Accounting Standards Board of Japan Statement No.25, June 30, 2010).
Financial Highlights