Ally Bank 2015 Annual Report Download - page 6
Download and view the complete annual report
Please find page 6 of the 2015 Ally Bank annual report below. You can navigate through the pages in the report by either clicking on the pages listed below, or by using the keyword search tool below to find specific information within the annual report.-
 1
1 -
 2
2 -
 3
3 -
 4
4 -
 5
5 -
 6
6 -
 7
7 -
 8
8 -
 9
9 -
 10
10 -
 11
11 -
 12
12 -
 13
13 -
 14
14 -
 15
15 -
 16
16 -
 17
17 -
18
-
19
-
20
-
21
-
22
-
23
-
24
-
25
-
26
-
27
-
28
-
29
-
30
-
31
-
32
-
33
-
34
-
35
-
36
-
37
-
38
-
39
-
40
-
41
-
42
-
43
-
44
-
45
-
46
-
47
-
48
-
49
-
50
-
51
-
52
-
53
-
54
-
55
-
56
-
57
-
58
-
59
-
60
-
61
-
62
-
63
-
64
-
65
-
66
-
67
-
68
-
69
-
70
-
71
-
72
-
73
-
74
-
75
-
76
-
77
-
78
-
79
-
80
-
81
-
82
-
83
-
84
-
85
-
86
-
87
-
88
-
89
-
90
-
91
-
92
-
93
-
94
-
95
-
96
-
97
-
98
-
99
-
100
-
101
-
102
-
103
-
104
-
105
-
106
-
107
-
108
-
109
-
110
-
111
-
112
-
113
-
114
-
115
-
116
-
117
-
118
-
119
-
120
-
121
-
122
-
123
-
124
-
125
-
126
-
127
-
128
-
129
-
130
-
131
-
132
-
133
-
134
-
135
-
136
-
137
-
138
-
139
-
140
-
141
-
142
-
143
-
144
-
145
-
146
-
147
-
148
-
149
-
150
-
151
-
152
-
153
-
154
-
155
-
156
-
157
-
158
-
159
-
160
-
161
-
162
-
163
-
164
-
165
-
166
-
167
-
168
-
169
-
170
-
171
-
172
-
173
-
174
-
175
-
176
-
177
-
178
-
179
-
180
-
181
-
182
-
183
-
184
 |
 |

($ millions) FY
20
1
5
FY
20
1
4
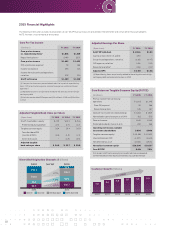
Core pre-tax income
,
ex. re
p
ositionin
g
item
s
1
$ 1,801 $ 1,61
9
R
epositioning items2(
3
4
9)
(1
8
7)
C
ore pre-tax income $ 1,452
$
1,43
2
O
ID amortization ex
p
ense
3
59
1
8
6
I
ncome tax expens
e
496
3
2
1
Income from discontinued o
p
erations,
n
et o
f
ta
x
392
225
G
AAP net income
$
1,28
9
$
1,150
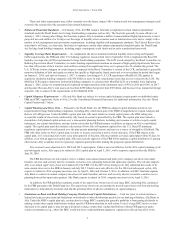
2015 Financial Highlights
(1) Core pre-tax income as presented excludes the impact of repositioning
items, OID amortization expense, income tax expense and discontinued
operations
(2) Repositioning items are primarily related to the extinguishment of high-
cost legacy debt
(3) Includes accelerated OID expense of $14 million in 2015 and $14 million
in 2014
Core Pre-Tax Income
Core Return on Tangible Common Equity (ROTCE)
Adjusted Earnings Per Share
Adjusted Tangible Book Value per Share
The following information includes reconciliations of non-GAAP nancial measures presented in the CEO letter and certain other nancial highlights.
NOTE: Numbers may not foot due to rounding.
2014 2015
Chrysler GM Standard GM SubventedGrowth
$8.3 +53%
+41%
+21%
$12.7
$9.6
$15.2
$3.4
$6.8
$12.6
$13.3
%Ƃ YoY$41.0 $41.0
2010 2011 2012 2013 2014 2015
4.0 4.4 4.8 5.1 5.3 5.5
7% CAGR
Customer Growth (millions)
($
per share
)
FY
20
15 FY
20
1
4
F
Y
20
13
G
AAP shareholder’s equit
y
$
27.9
$
32.1
$
29.6
P
referred equity & goodwill
(
1.5
)
(
2.7
)
(
2.7
)
T
angi
bl
e common equity
26
.4
29
.4
26
.
9
Tax-eect bond
O
ID
(
tax rate of
3
4%
)
(
1.8
)
(
1.
9)
(2
.1
)
S
eries
G
discoun
t
–
(4.
9
)
(
4.
9)
A
djusted tangible
b
oo
k
va
l
ue
p
er s
h
are
$
24.
6
$
22.
7
$
20.
0
($ millions)
F
Y 2
0
1
5
FY 2
0
14
P
re-tax income from continuin
g
operation
s
$
1
,
39
3
$ 1
,
24
6
C
ore OID expens
e
59
18
6
R
epositioning item
s
3
4
9
1
8
7
C
ore pre-tax income (ex. repositioning
)
$
1
,
80
1
$
1
,
619
N
ormalized income tax expense at 34
%
6
12
550
C
ore net income 1,189 1,
069
P
referred dividends (
S
eries A
&
G
)
200
26
8
Operating net income available
to
co
mm
o
n
sh
ar
eholde
r
s
$
990
$
800
T
an
g
ible common equit
y
1
$
13,41
6
$
13,522
U
namortized core
O
I
D
(1,
32
7)
(
1,441
)
N
et deferred tax asse
t
(1,5
8
3
)
(1,923)
N
orma
l
ize
d
common equit
y
2
$
10,506 $ 10,157
C
ore ROTCE
1
9
.4
%
7.9
%
(
1) Includes GAAP common equity less preferred stock and goodwil
l
(
2
)
Normalized common equity calculated using 2 period averag
e
(
$ per share
)
F
Y
20
1
5
F
Y
20
1
4
G
AAP EPS
(
diluted
)
$
(
2.66
)
$ 1.8
3
C
apital actions
(S
eries A and
G)
4
.
90
–
Discontinued operations, net o
f
ta
x
(
0.
8
1)
(0
.47)
OID expense, net of ta
x
0.0
8
0
.25
R
epositioning
/
ot
h
e
r
1
0
.4
8
0
.
07
Ad
j
usted EP
S
$
2.00
$
1.6
8
(
1
)
Repositioning items are primarily related to the extinguishment of high-
c
ost legacy debt and a discrete tax item in
20
14
Diversied Origination Channels ($ billions)
IV