Ally Bank 2015 Annual Report Download - page 3
Download and view the complete annual report
Please find page 3 of the 2015 Ally Bank annual report below. You can navigate through the pages in the report by either clicking on the pages listed below, or by using the keyword search tool below to find specific information within the annual report.-
 1
1 -
 2
2 -
 3
3 -
 4
4 -
 5
5 -
 6
6 -
 7
7 -
 8
8 -
 9
9 -
 10
10 -
 11
11 -
 12
12 -
 13
13 -
 14
14 -
15
-
16
-
17
-
18
-
19
-
20
-
21
-
22
-
23
-
24
-
25
-
26
-
27
-
28
-
29
-
30
-
31
-
32
-
33
-
34
-
35
-
36
-
37
-
38
-
39
-
40
-
41
-
42
-
43
-
44
-
45
-
46
-
47
-
48
-
49
-
50
-
51
-
52
-
53
-
54
-
55
-
56
-
57
-
58
-
59
-
60
-
61
-
62
-
63
-
64
-
65
-
66
-
67
-
68
-
69
-
70
-
71
-
72
-
73
-
74
-
75
-
76
-
77
-
78
-
79
-
80
-
81
-
82
-
83
-
84
-
85
-
86
-
87
-
88
-
89
-
90
-
91
-
92
-
93
-
94
-
95
-
96
-
97
-
98
-
99
-
100
-
101
-
102
-
103
-
104
-
105
-
106
-
107
-
108
-
109
-
110
-
111
-
112
-
113
-
114
-
115
-
116
-
117
-
118
-
119
-
120
-
121
-
122
-
123
-
124
-
125
-
126
-
127
-
128
-
129
-
130
-
131
-
132
-
133
-
134
-
135
-
136
-
137
-
138
-
139
-
140
-
141
-
142
-
143
-
144
-
145
-
146
-
147
-
148
-
149
-
150
-
151
-
152
-
153
-
154
-
155
-
156
-
157
-
158
-
159
-
160
-
161
-
162
-
163
-
164
-
165
-
166
-
167
-
168
-
169
-
170
-
171
-
172
-
173
-
174
-
175
-
176
-
177
-
178
-
179
-
180
-
181
-
182
-
183
-
184
 |
 |

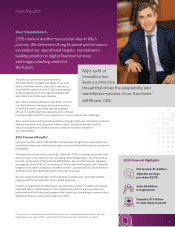
Dear Shareholders,
2015 marked another successful step in Ally’s
journey. We delivered strong nancial performance,
exceeded our operational targets, maintained a
leading position in digital nancial services
and began planting seeds for
the future. “Ally’s spirit of
innovation has
been a connective
thread that drives the adaptability and
marketplace success of our franchises.”
Je Brown, CEO
The past year presented opportunities to
demonstrate the strength and agility of our auto
nance franchise as we continued to expand our
active dealer network to over 17,500 relationships
and to establish new nancing partnerships with
automakers and online auto retailers.
Ally’s direct banking subsidiary, Ally Bank, crossed
over $55 billion in retail deposits from more than
1.1 million primary customers. We drove greater
eciency in gathering those deposits and continued
to achieve high marks from our customers on service and product oerings.
Ally’s operational and nancial foundation is stronger than ever, and when combined
with our innovative and customer-centric culture, we believe we have built an
attractive business model that has and continues to deliver results for
our shareholders.
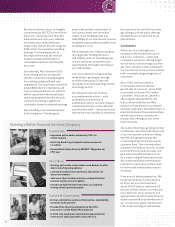
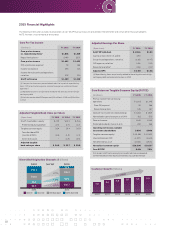
2015 Financial Results*
Last year’s performance reected the fundamental strength of our operations, the
momentum underway and the successful execution of the multi-year plan to improve
protability.
Ally reported full year net income of $1.3 billion for 2015, increasing 12 percent from
the prior year. Core pretax income, excluding repositioning items, also improved 11
percent compared to 2014 and totaled $1.8 billion. We reported full year adjusted
earnings per share of $2.00, an increase of 19 percent from the prior year. Adjusted
tangible book value continued to increase, as well – up nearly $2.00 per share from
2014 and more than $4.50 per share in the past two years.
We also achieved sustainable returns and improved eciency and made notable
progress on the normalization of our capital structure.
In 2015, we redeemed all of the Series G preferred securities. In addition to helping
normalize Ally’s capital structure, their redemption will drive improved nancial
performance in the future and supports Ally’s objective of initiating a common stock
dividend and share repurchase program in 2016.
Auto: $41 billion
in originations
Net income: $1.3 billion
Adjusted earnings
per share: $2.00
2015 Financial Highlights
Deposits: $7.5 billion
in retail deposit growth
* Certain metrics presented are non-GAAP nancial measures, including core pre-tax income, adjusted
tangible book value, adjusted EPS, and Core ROTCE. Refer to page 4 for reconciliations to GAAP.
From the
C
E
O
I