Allegheny Power 2014 Annual Report Download - page 2
Download and view the complete annual report
Please find page 2 of the 2014 Allegheny Power annual report below. You can navigate through the pages in the report by either clicking on the pages listed below, or by using the keyword search tool below to find specific information within the annual report.-
 1
1 -
 2
2 -
 3
3 -
 4
4 -
 5
5 -
 6
6 -
 7
7 -
 8
8 -
 9
9 -
 10
10 -
 11
11 -
 12
12 -
 13
13 -
14
-
15
-
16
-
17
-
18
-
19
-
20
-
21
-
22
-
23
-
24
-
25
-
26
-
27
-
28
-
29
-
30
-
31
-
32
-
33
-
34
-
35
-
36
-
37
-
38
-
39
-
40
-
41
-
42
-
43
-
44
-
45
-
46
-
47
-
48
-
49
-
50
-
51
-
52
-
53
-
54
-
55
-
56
-
57
-
58
-
59
-
60
-
61
-
62
-
63
-
64
-
65
-
66
-
67
-
68
-
69
-
70
-
71
-
72
-
73
-
74
-
75
-
76
-
77
-
78
-
79
-
80
-
81
-
82
-
83
-
84
-
85
-
86
-
87
-
88
-
89
-
90
-
91
-
92
-
93
-
94
-
95
-
96
-
97
-
98
-
99
-
100
-
101
-
102
-
103
-
104
-
105
-
106
-
107
-
108
-
109
-
110
-
111
-
112
-
113
-
114
-
115
-
116
-
117
-
118
-
119
-
120
-
121
-
122
-
123
-
124
-
125
-
126
-
127
-
128
-
129
-
130
-
131
-
132
-
133
-
134
-
135
-
136
-
137
-
138
-
139
-
140
-
141
-
142
-
143
-
144
-
145
-
146
-
147
-
148
-
149
-
150
-
151
-
152
-
153
-
154
-
155
-
156
-
157
-
158
-
159
 |
 |

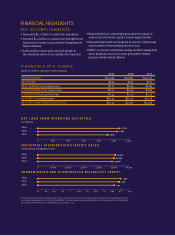
FINANCIAL HIGHLIGHTS
KEY ACCOMPLISHMENTS
• Generated $2.7 billion in cash from operations
• Invested $1.4 billion to expand and strengthen our
transmission system as part of our Energizing the
Future initiative
• Achieved five consecutive years of growth in
the industrial sector of our distribution business
• Repositioned our competitive generation business to
reduce risk and better capture market opportunities
• Moved forward with our program to install 2 million new
smart meters in Pennsylvania by mid-2019
• Efforts to ensure competitive energy markets adequately
value baseload coal and nuclear generation helped
produce initial market reforms
FINANCIALS AT A GLANCE
(dollars in millions, except per share amounts)
2014 2013 2012
TOTAL REVENUES $15,049 $14,892 $15,255
NET INCOME $299 $392 $771
BASIC EARNINGS per common share $0.71 $0.94 $1.85
DILUTED EARNINGS per common share $0.71 $0.94 $1.84
DIVIDENDS PAID per common share $1.44 $2.20 $2.20
BOOK VALUE per common share $29.49 $30.32 $31.29
NET CASH FROM OPERATING ACTIVITIES $2,713 $2,662 $2,320
NET CASH FROM OPERATING ACTIVITIES
(in millions)
2014
2013
2012
2,662
2,320
2,713
0 2,000 2,500 3,000500 1,000 1,500
* FirstEnergy’s index is comprised of two indices that are commonly used in the electric utility industry: Transmission Outage Frequency (TOF)
and System Average Interruption Duration Index (SAIDI). Our index measures frequency and duration of service interruptions: the better the
performance, the higher the score. The highest score possible is 2.75.
TRANSMISSION AND DISTRIBUTION RELIABILITY INDEX*
2014
2013
2012 2.31
INDUSTRIAL DISTRIBUTION ELECTRIC SALES
(in thousands of megawatt-hours)
2014
2013
2012
50,243
49,378
51,213
2.47
2.56
0 40,000 50,000 60,00010,000 30,00020,000
0 2 2.5 2.750.5 1 1.5.25 .75 1.25 1.75 2.25