Allegheny Power 2013 Annual Report Download - page 2
Download and view the complete annual report
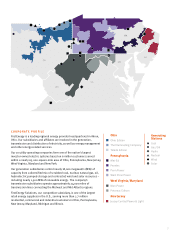
Please find page 2 of the 2013 Allegheny Power annual report below. You can navigate through the pages in the report by either clicking on the pages listed below, or by using the keyword search tool below to find specific information within the annual report.-
 1
1 -
 2
2 -
 3
3 -
 4
4 -
 5
5 -
 6
6 -
 7
7 -
 8
8 -
 9
9 -
 10
10 -
 11
11 -
 12
12 -
 13
13 -
14
-
15
-
16
-
17
-
18
-
19
-
20
-
21
-
22
-
23
-
24
-
25
-
26
-
27
-
28
-
29
-
30
-
31
-
32
-
33
-
34
-
35
-
36
-
37
-
38
-
39
-
40
-
41
-
42
-
43
-
44
-
45
-
46
-
47
-
48
-
49
-
50
-
51
-
52
-
53
-
54
-
55
-
56
-
57
-
58
-
59
-
60
-
61
-
62
-
63
-
64
-
65
-
66
-
67
-
68
-
69
-
70
-
71
-
72
-
73
-
74
-
75
-
76
-
77
-
78
-
79
-
80
-
81
-
82
-
83
-
84
-
85
-
86
-
87
-
88
-
89
-
90
-
91
-
92
-
93
-
94
-
95
-
96
-
97
-
98
-
99
-
100
-
101
-
102
-
103
-
104
-
105
-
106
-
107
-
108
-
109
-
110
-
111
-
112
-
113
-
114
-
115
-
116
-
117
-
118
-
119
-
120
-
121
-
122
-
123
-
124
-
125
-
126
-
127
-
128
-
129
-
130
-
131
-
132
-
133
-
134
-
135
-
136
-
137
-
138
-
139
-
140
-
141
-
142
-
143
-
144
-
145
-
146
-
147
-
148
-
149
-
150
-
151
-
152
-
153
-
154
-
155
-
156
-
157
-
158
-
159
-
160
-
161
-
162
-
163
-
164
-
165
-
166
-
167
-
168
-
169
-
170
-
171
-
172
-
173
-
174
-
175
-
176
 |
 |

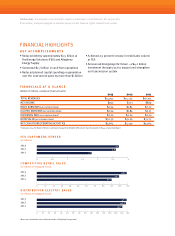
141.6
FES CUSTOMERS SERVED
(in millions)
2013
2012
2011
2.6
1.8
2.7
COMPETITIVE RETAIL SALES
(in millions of megawatt-hours)
2013
2012
2011
99.7
90.1
108.6
DISTRIBUTION ELECTRIC SALES
(in millions of megawatt-hours)
2013
2012
2011
146.6
147.9
FINANCIAL HIGHLIGHTS
KEY ACCOMPLISHMENTS
• Reduced debt by approximately $1.5 billion at
FirstEnergy Solutions (FES) and Allegheny
Energy Supply
• Generated $2.7 billion in cash from operations
• Reduced planned capital spending on generation
over the next several years by more than $1 billion
• Achieved a 9 percent increase in retail sales volume
at FES
• Announced Energizing the Future – a $4.2 billion
investment through 2017 to expand and strengthen
our transmission system
FINANCIALS AT A GLANCE
(dollars in millions, except per share amounts)
2013 2012 2011
TOTAL REVENUES $14,917 $15,273 $16,105
NET INCOME $392 $771 $869
BASIC EARNINGS per common share $0.94 $1.85 $2.22
DILUTED EARNINGS per common share $0.94 $1.84 $2.21
DIVIDENDS PAID per common share* $2.20 $2.20 $2.20
BOOK VALUE per common share $30.32 $31.29 $31.75
NET CASH FROM OPERATING ACTIVITIES $2,662 $2,320 $3,063
0 2 2.5 30.5 1 1.5
0 60 80 11010 30 4020 50 70 90
0 60 8010 30 4020 50 70 90 100
On the cover: A monopole is constructed to replace a steel tower in East Hanover, N.J., as part of a
$200 million, multiyear program to enhance Jersey Central Power & Light’s transmission system.
*In January 2014, the Board of Directors announced a quarterly dividend of $0.36 per share (equivalent to $1.44 on an annual basis)
100
110 120 130 140 150
(Note: 2011 distribution sales reflect 10 months of Allegheny Energy sales)